TABLUM.IO is a powerful tool for ingesting data from unstructured sources such as files, feeds, or API responses. It parses data, generates a suitable data schema, and automatically inserts the data into the created SQL table. However, sometimes specific transformations, cleansing, filtering, or aggregation may be too complex to be done during ingestion. In such cases, TABLUM.IO’s ‘Query via SQL’ feature can be used to achieve these tasks afterwards.
‘Query via SQL’ allows users to run pure SQL queries (in ClickHouse SQL dialect) against the already ingested data. Queries can be organized in chains and configured to run periodically for automation.
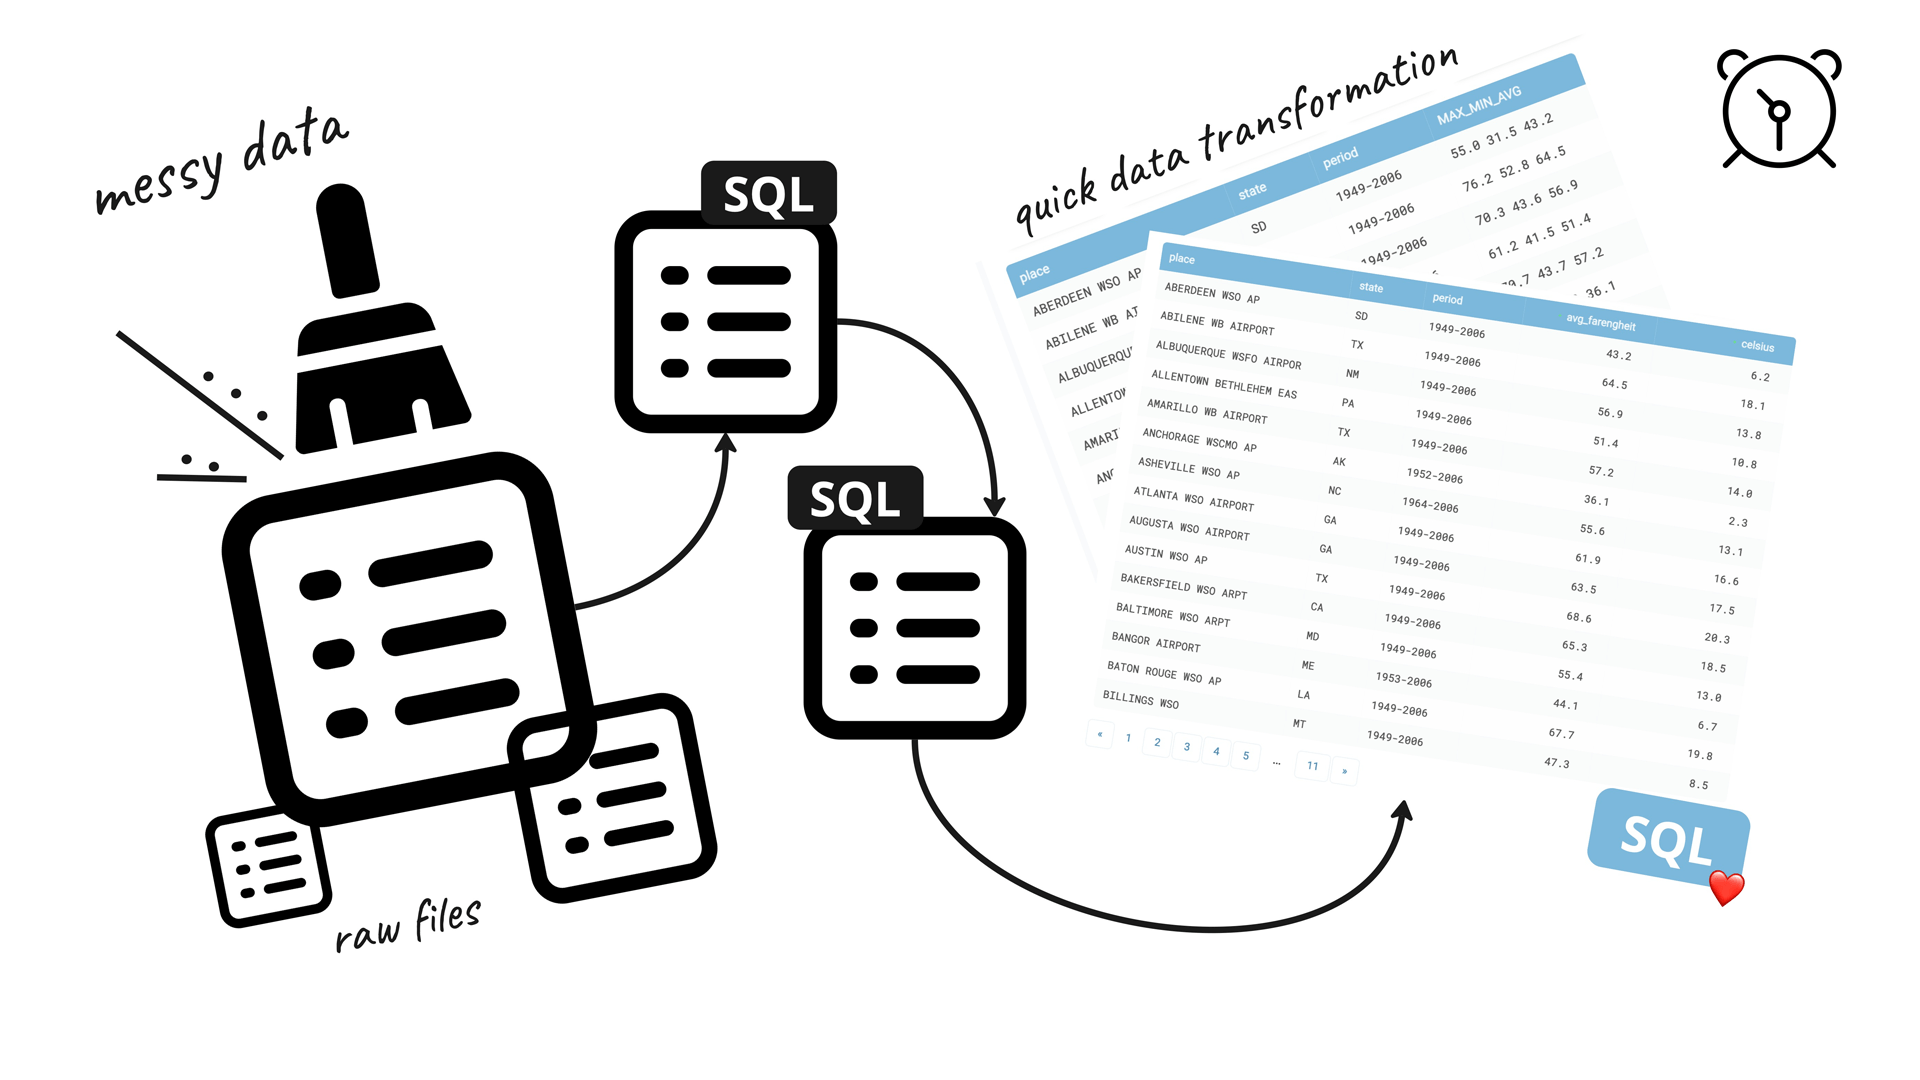
In this article, we will demonstrate how TABLUM.IO makes it easy to ingest, parse, cleanse, and enhance data loaded from an HTML table.
We will start by ingesting data copied from a webpage into TABLUM.IO and then perform some transformations to make it ready for analytics.
For those who prefer video content, please refer to the video below:
‘Query via SQL’ allows users to run pure SQL queries (in ClickHouse SQL dialect) against the already ingested data. Queries can be organized in chains and configured to run periodically for automation.
In this article, we will demonstrate how TABLUM.IO makes it easy to ingest, parse, cleanse, and enhance data loaded from an HTML table.
We will start by ingesting data copied from a webpage into TABLUM.IO and then perform some transformations to make it ready for analytics.
For those who prefer video content, please refer to the video below:
Data source
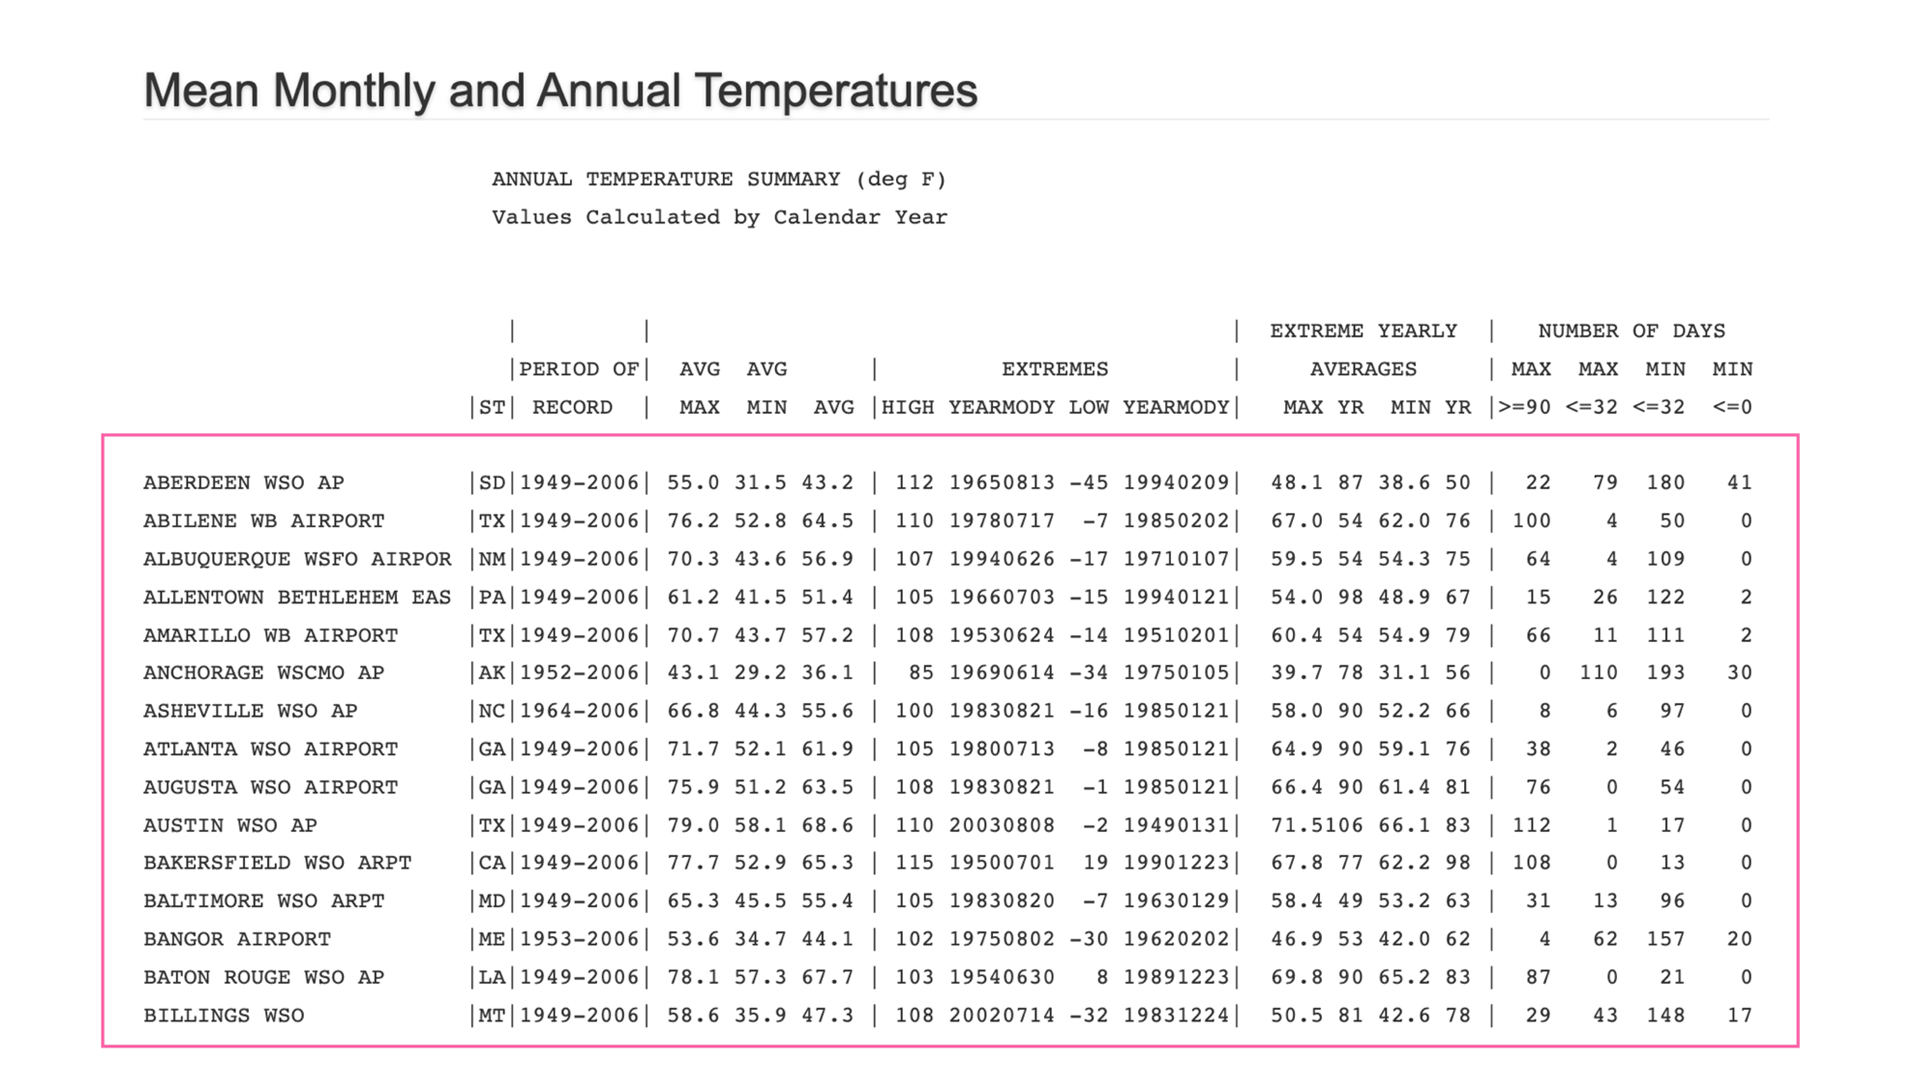
In our example, we will use the Western Regional Climate Center website, specifically, the Mean Monthly and Annual Temperatures dataset represented as an HTML table. This dataset includes historical data for various locations across the United States. The table contains location and month, as well as the annual average temperature, all of which are presented in degrees Fahrenheit.
Our objectives
Our project objectives are to efficiently convert the HTML table into a SQL database, ensure data accuracy and consistency through parsing and cleansing, and convert average temperature values from Fahrenheit to Celsius for enhanced usability across various contexts.
Step 1
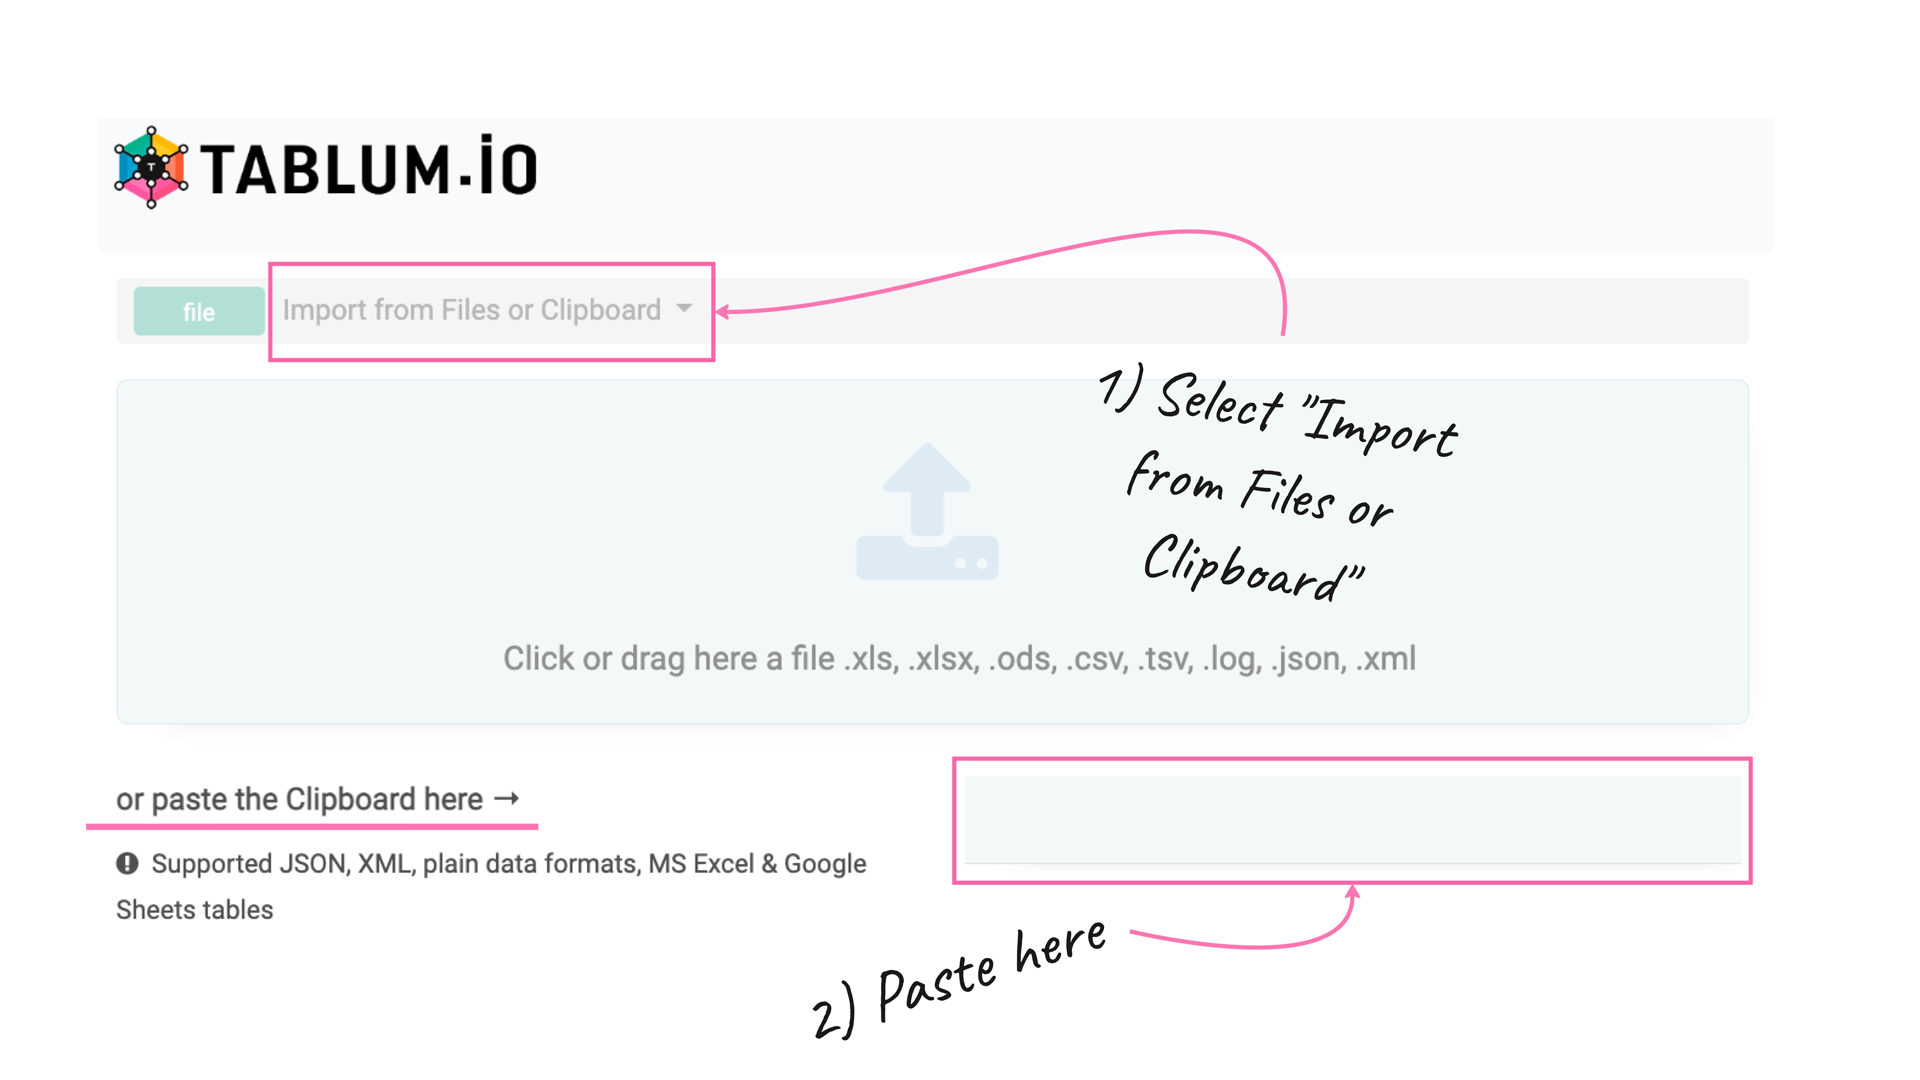
To kickstart our data transformation process, we’ll import the entire HTML table from the webpage by copying it into the Clipboard and pasting it in TABLUM.IO. The tool then automatically converts the data into a SQL database with the appropriate data schema.
This allows us to run queries on the ingested data to prepare the information we need for further analysis. The process is fast and efficient, taking only a few seconds to complete.
This allows us to run queries on the ingested data to prepare the information we need for further analysis. The process is fast and efficient, taking only a few seconds to complete.
Step 2
After importing the data, we need to clean the dataset to improve its quality and usability. This involves removing unnecessary columns and renaming existing ones to streamline the dataset for further analysis.
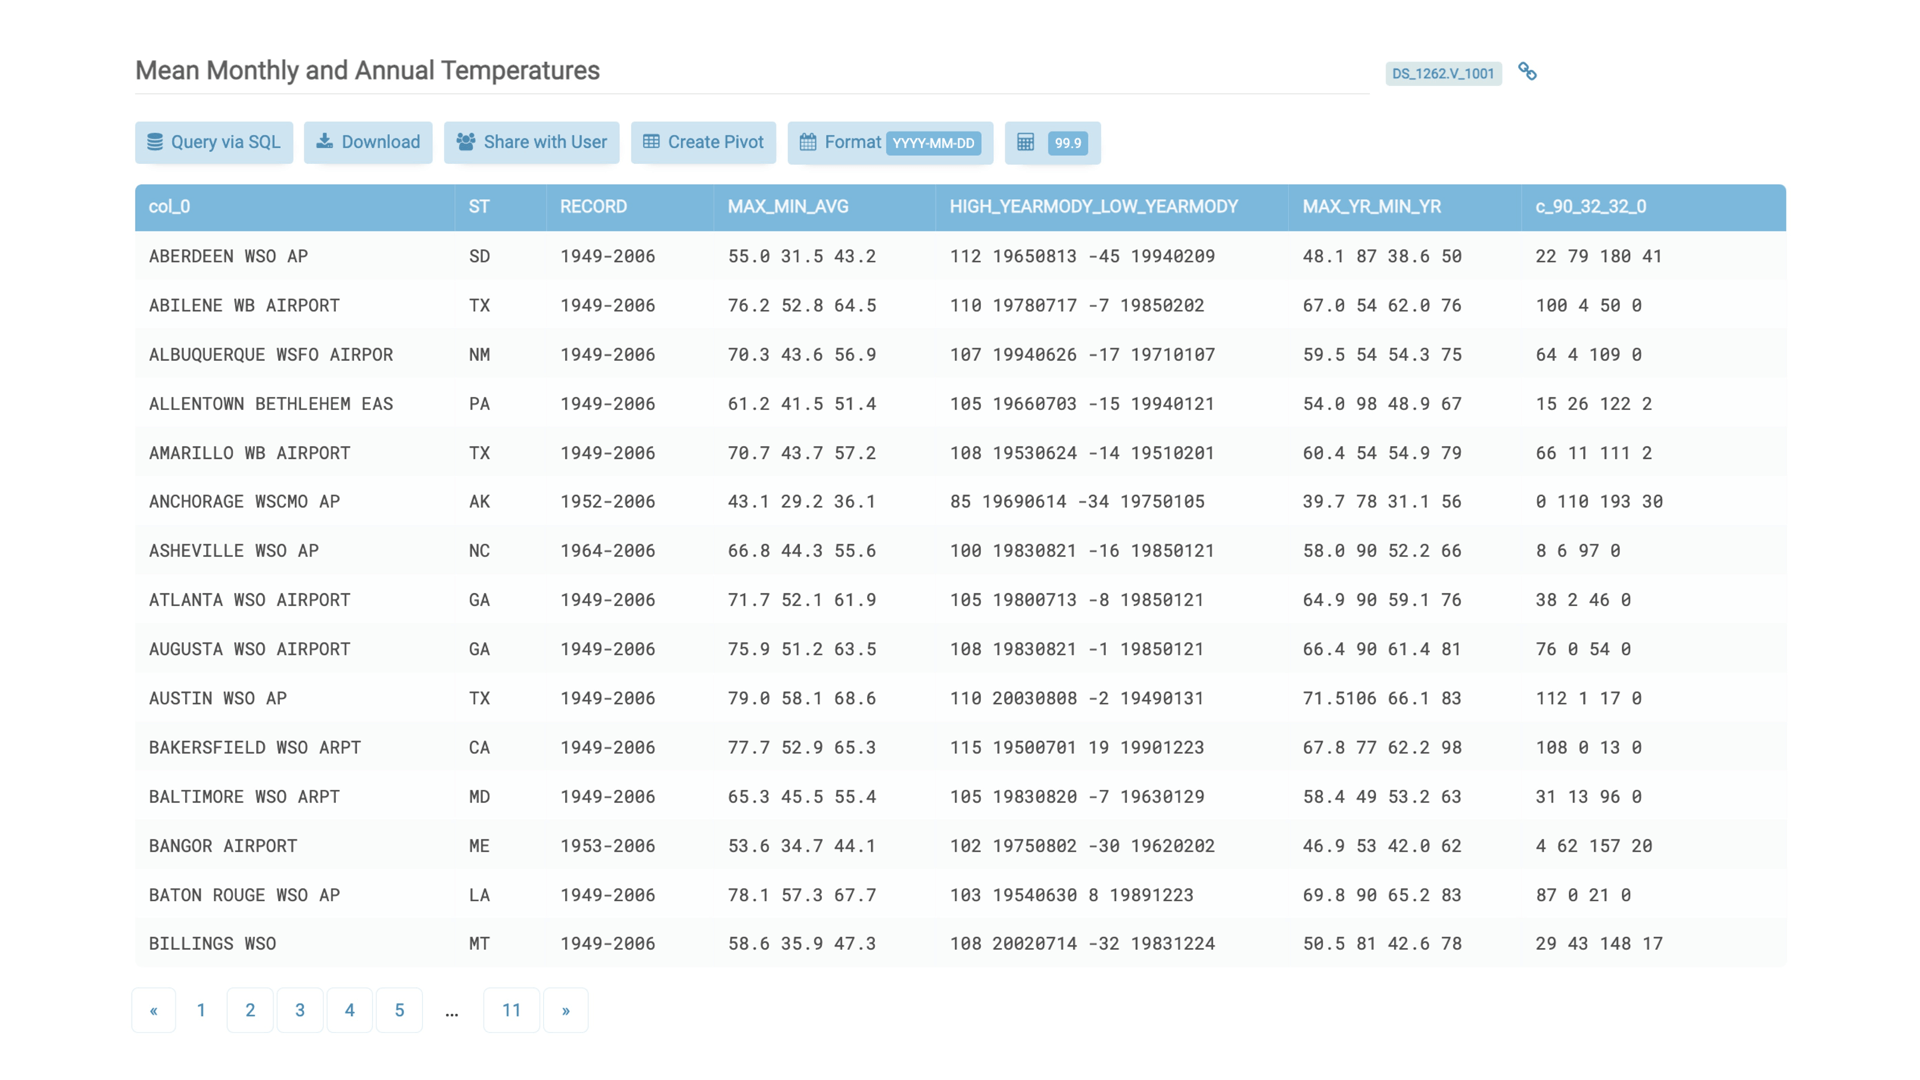
To begin querying the ingested data, simply click on the ‘Query via SQL’ button:
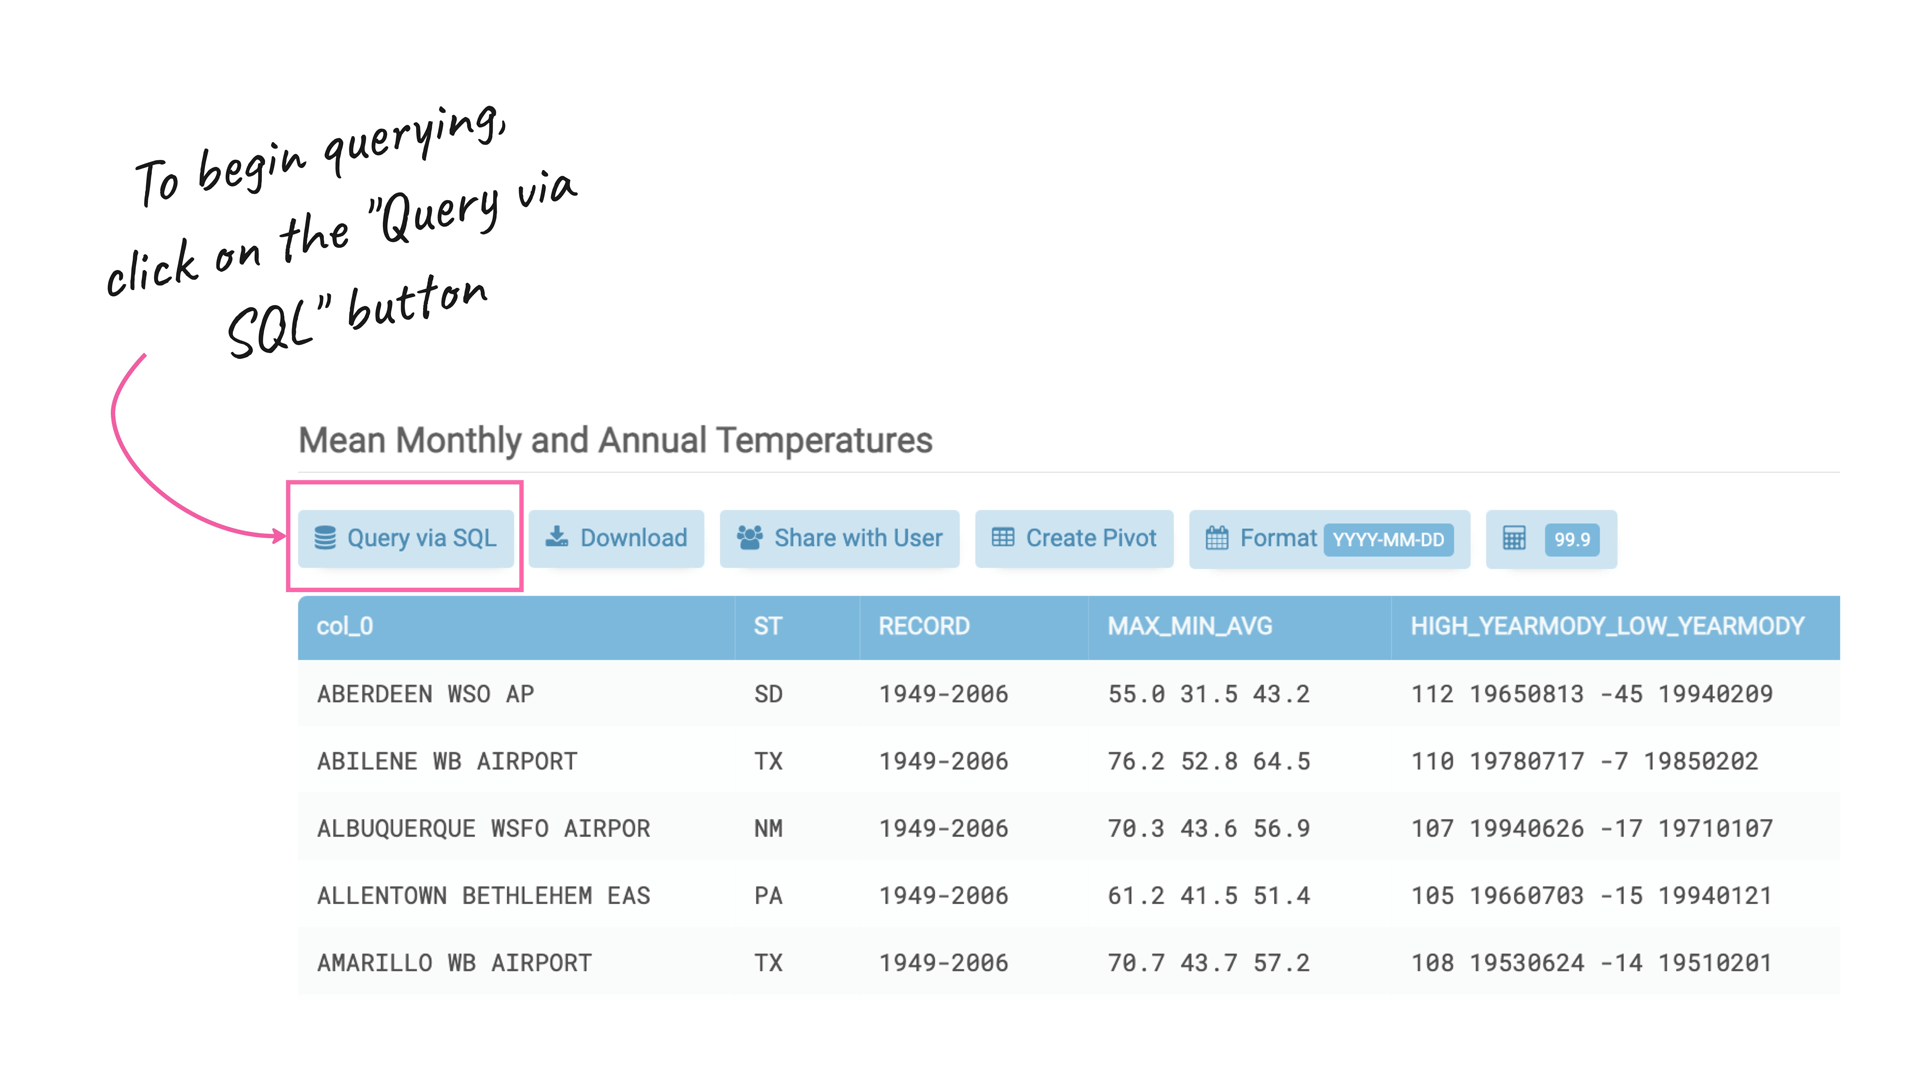
The resulting table contains column names that are not human-readable, as they were automatically taken from the original table headers. Additionally, there are a few unnecessary columns that we want to remove.
To make the column names more readable and remove the unnecessary columns from the resulting table, we can run the following SQL query on the original ingested data stored in the DS_.V_1001 view (which can be thought of as a SQL table):
To make the column names more readable and remove the unnecessary columns from the resulting table, we can run the following SQL query on the original ingested data stored in the DS_.V_1001 view (which can be thought of as a SQL table):
SELECT
 col_0 as place,
 ST as state,
 RECORD as period,
 MAX_MIN_AVG
FROM
 DS_.V_1001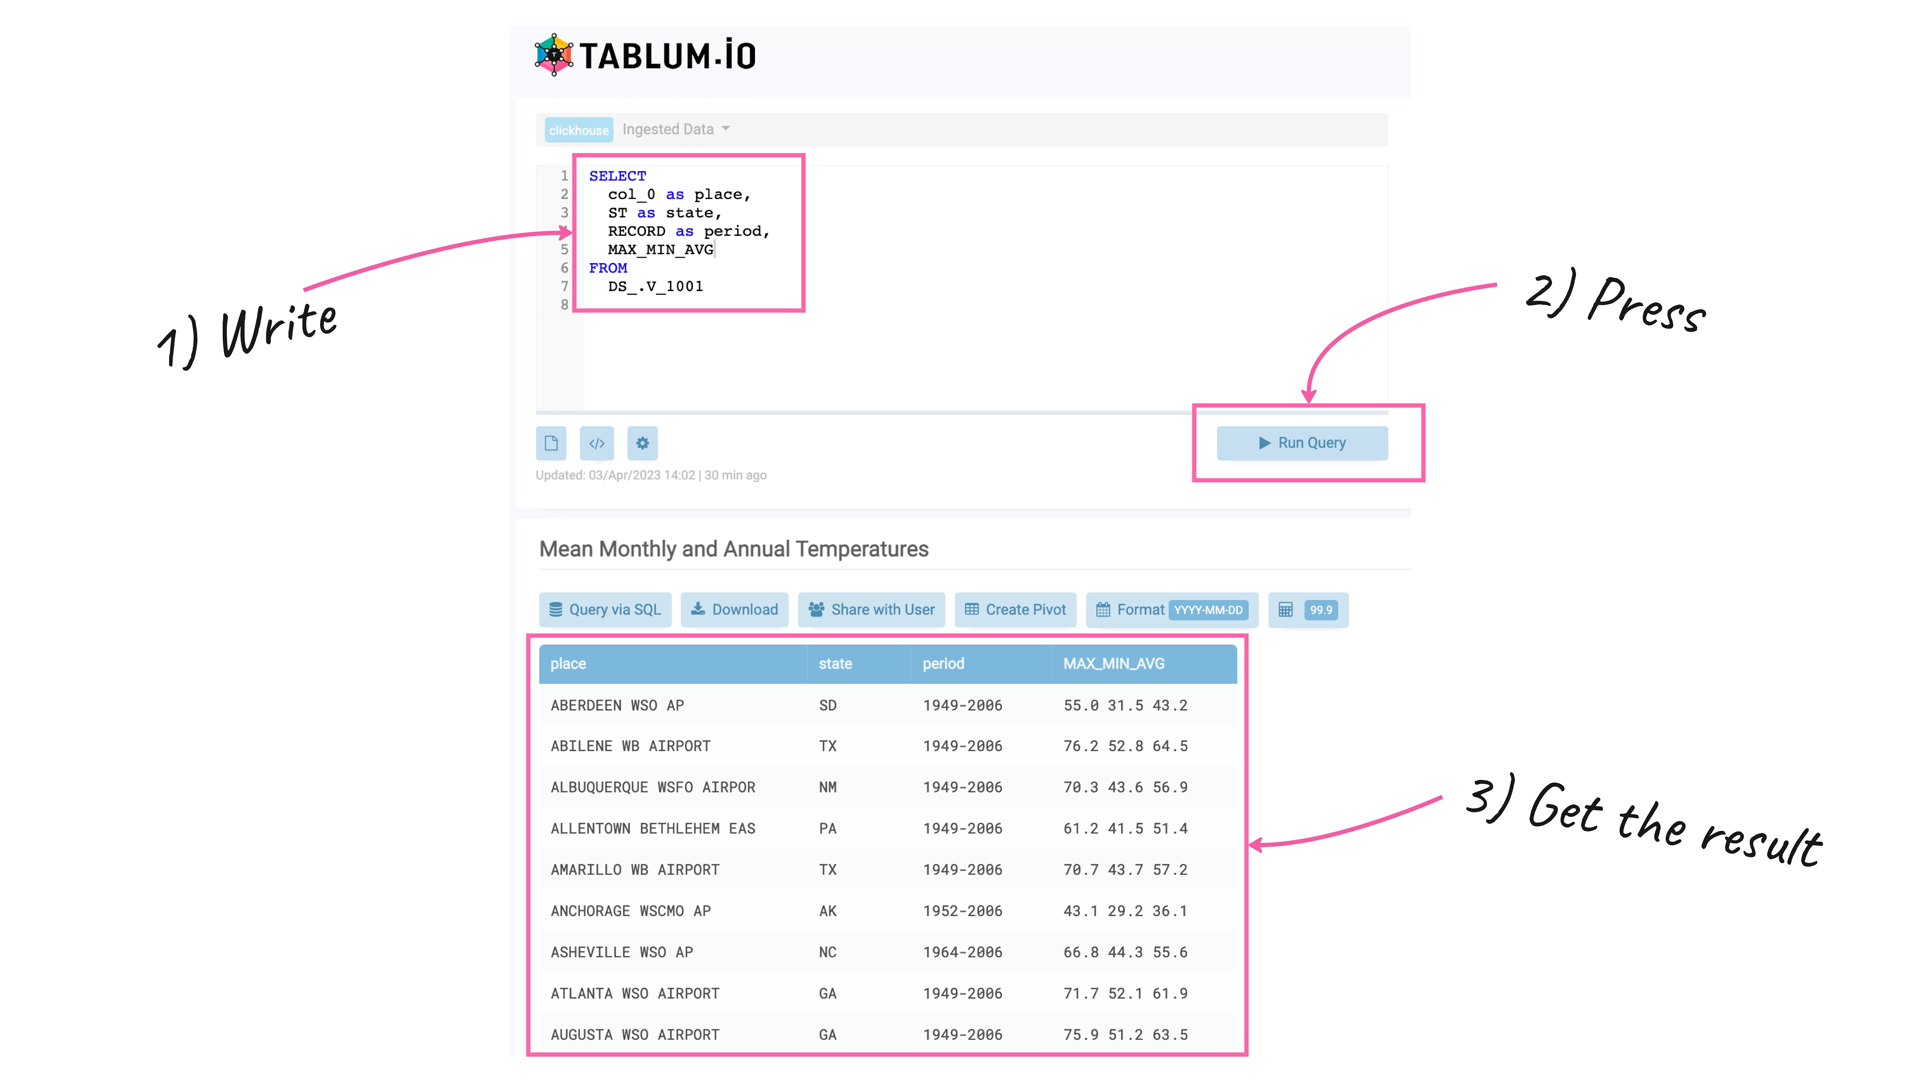
Step 3
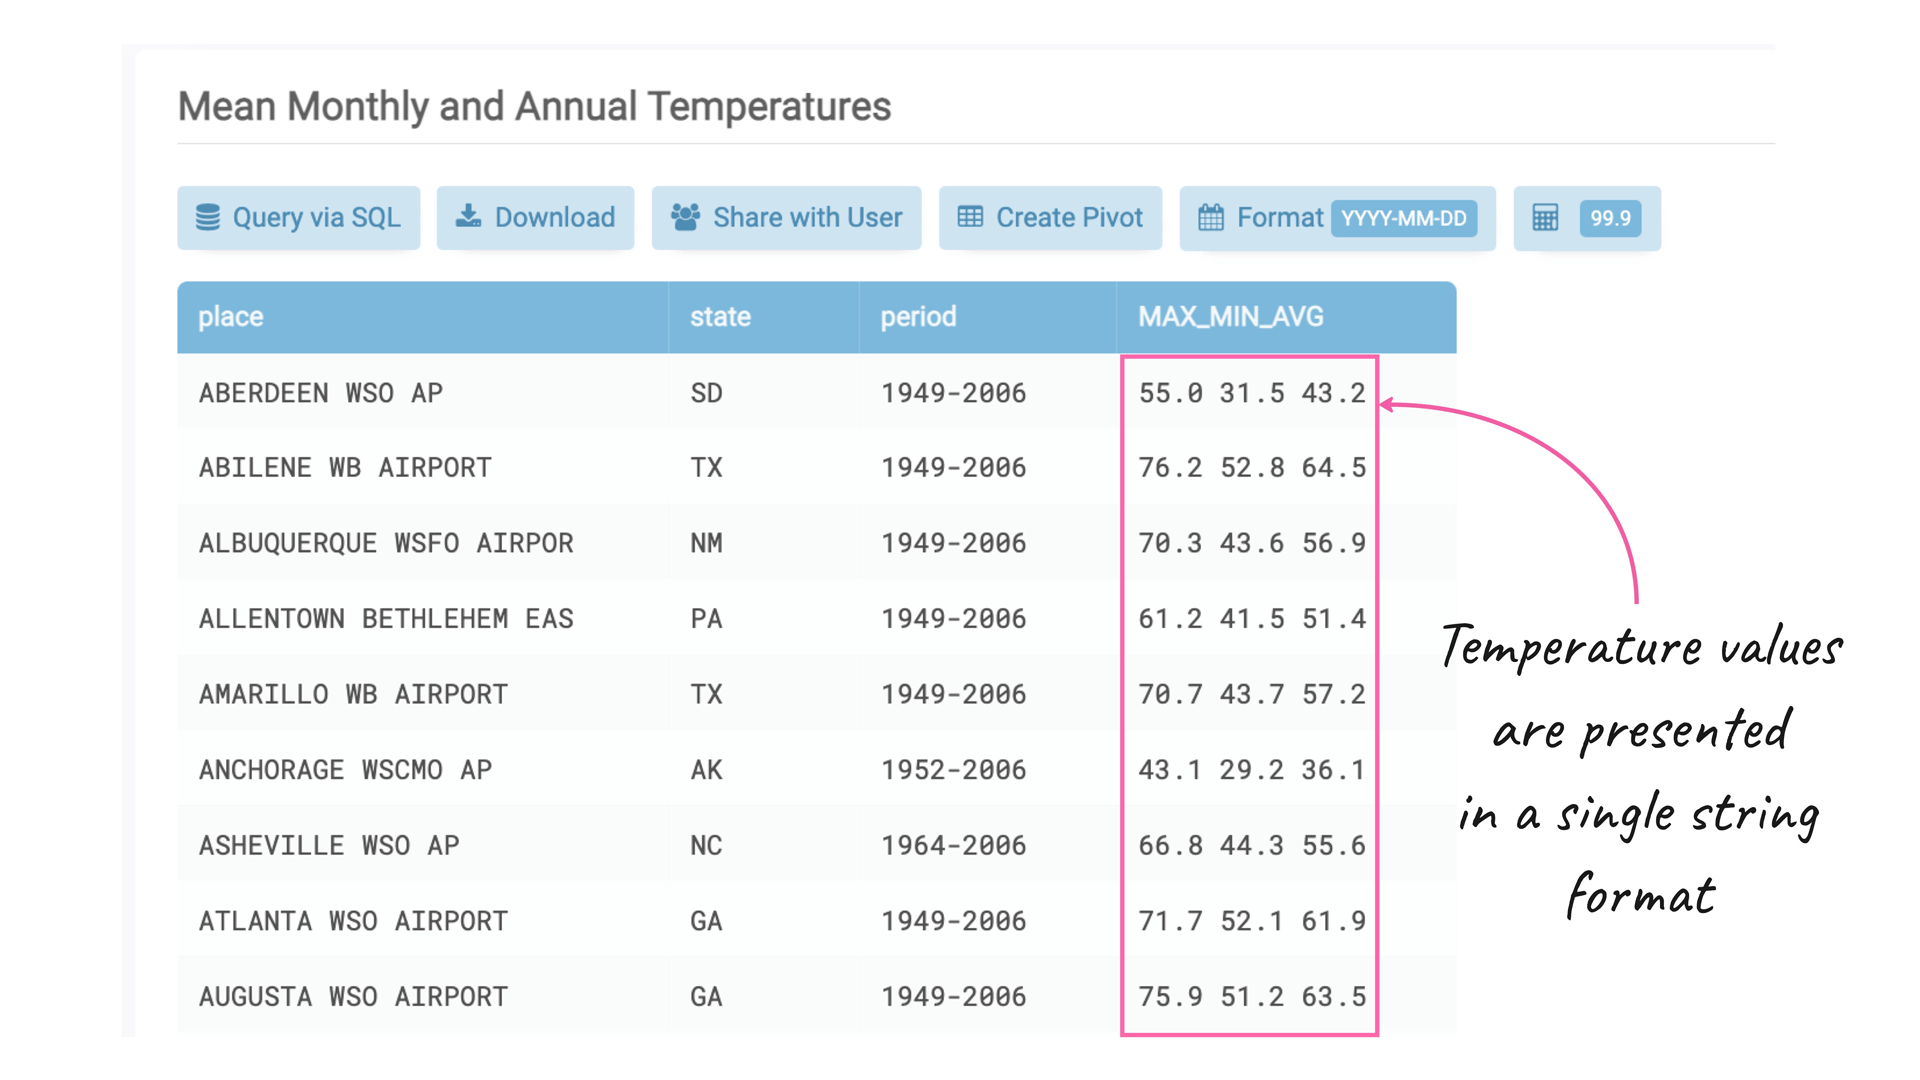
Now it looks much better. However, we still have excessive data in the MAX_MIN_AVG column. As you may have noticed, the fourth column of the dataset contains an array of values with the maximum, minimum, and average temperatures separated by spaces, and it’s in a string format. We want to extract only the average temperature and convert it to a floating-point number:
To extract the average temperature value from the string column, we can use a SQL query with the embedded ‘extract()’ function of ClickHouse, along with the following regular expression: ‘\d+.\d+\s+\d+.\d+\s+(\d+.\d+)’.
This regular expression matches the three temperature values in the string column and extracts the average temperature value as a floating-point number:
This regular expression matches the three temperature values in the string column and extracts the average temperature value as a floating-point number:
SELECT
  col_0 as place,
  ST as state,
  RECORD as period,
  extract(MAX_MIN_AVG, '\d+\.\d+\s+\d+\.\d+\s+(\d+\.\d+)') as avg_farengheit
FROM
  DS_.V_1001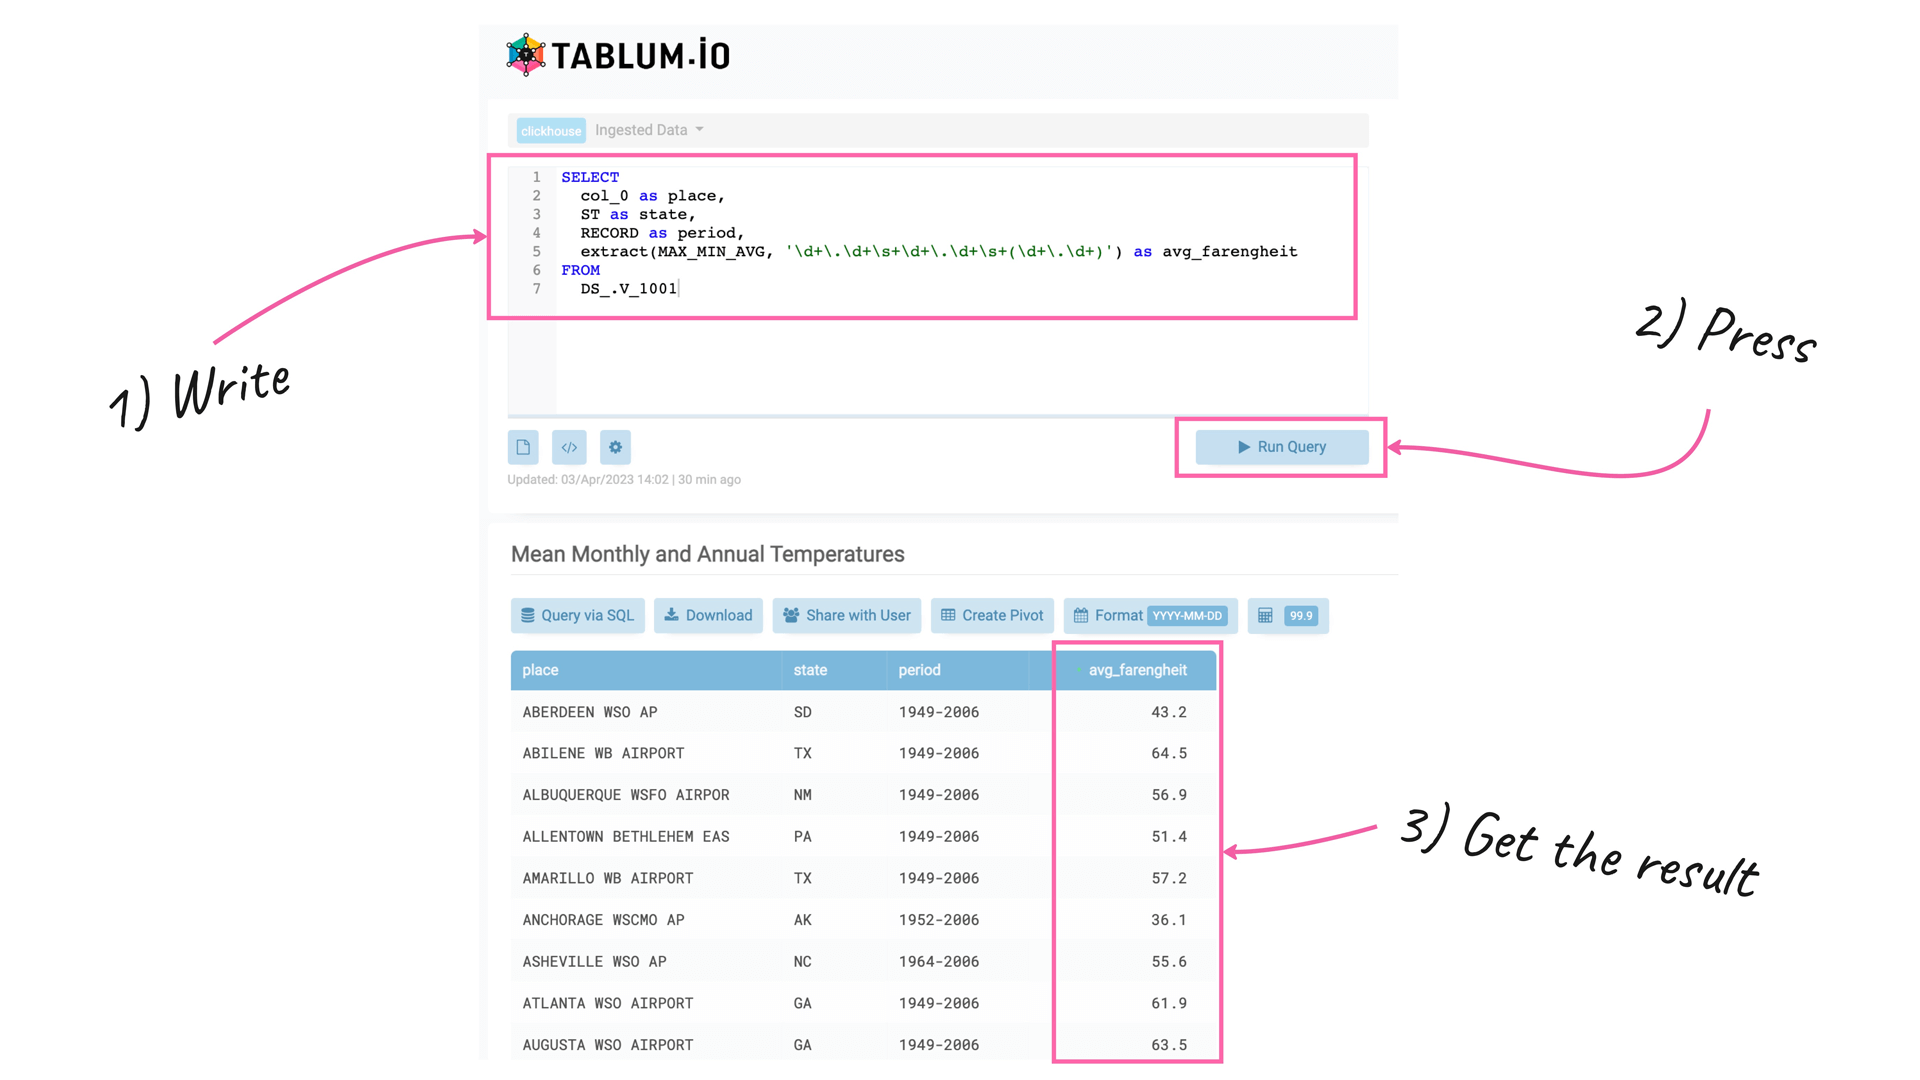
Step 4
Regarding the temperature data, let’s add a new column named “celsius” by converting the “avg_fahrenheit” column from Fahrenheit to Celsius using the commonly known formula: (Fahrenheit — 32) * 5/9. This can be achieved with a SQL query:
SELECT
 col_0 as place,
  ST as state,
  RECORD as period,
  toFloat32(extract(MAX_MIN_AVG, '\d+\.\d+\s+\d+\.\d+\s+(\d+\.\d+)')) as avg_farengheit,
  (avg_farengheit - 32) * 5/9 AS celsius
FROM
  DS_.V_1001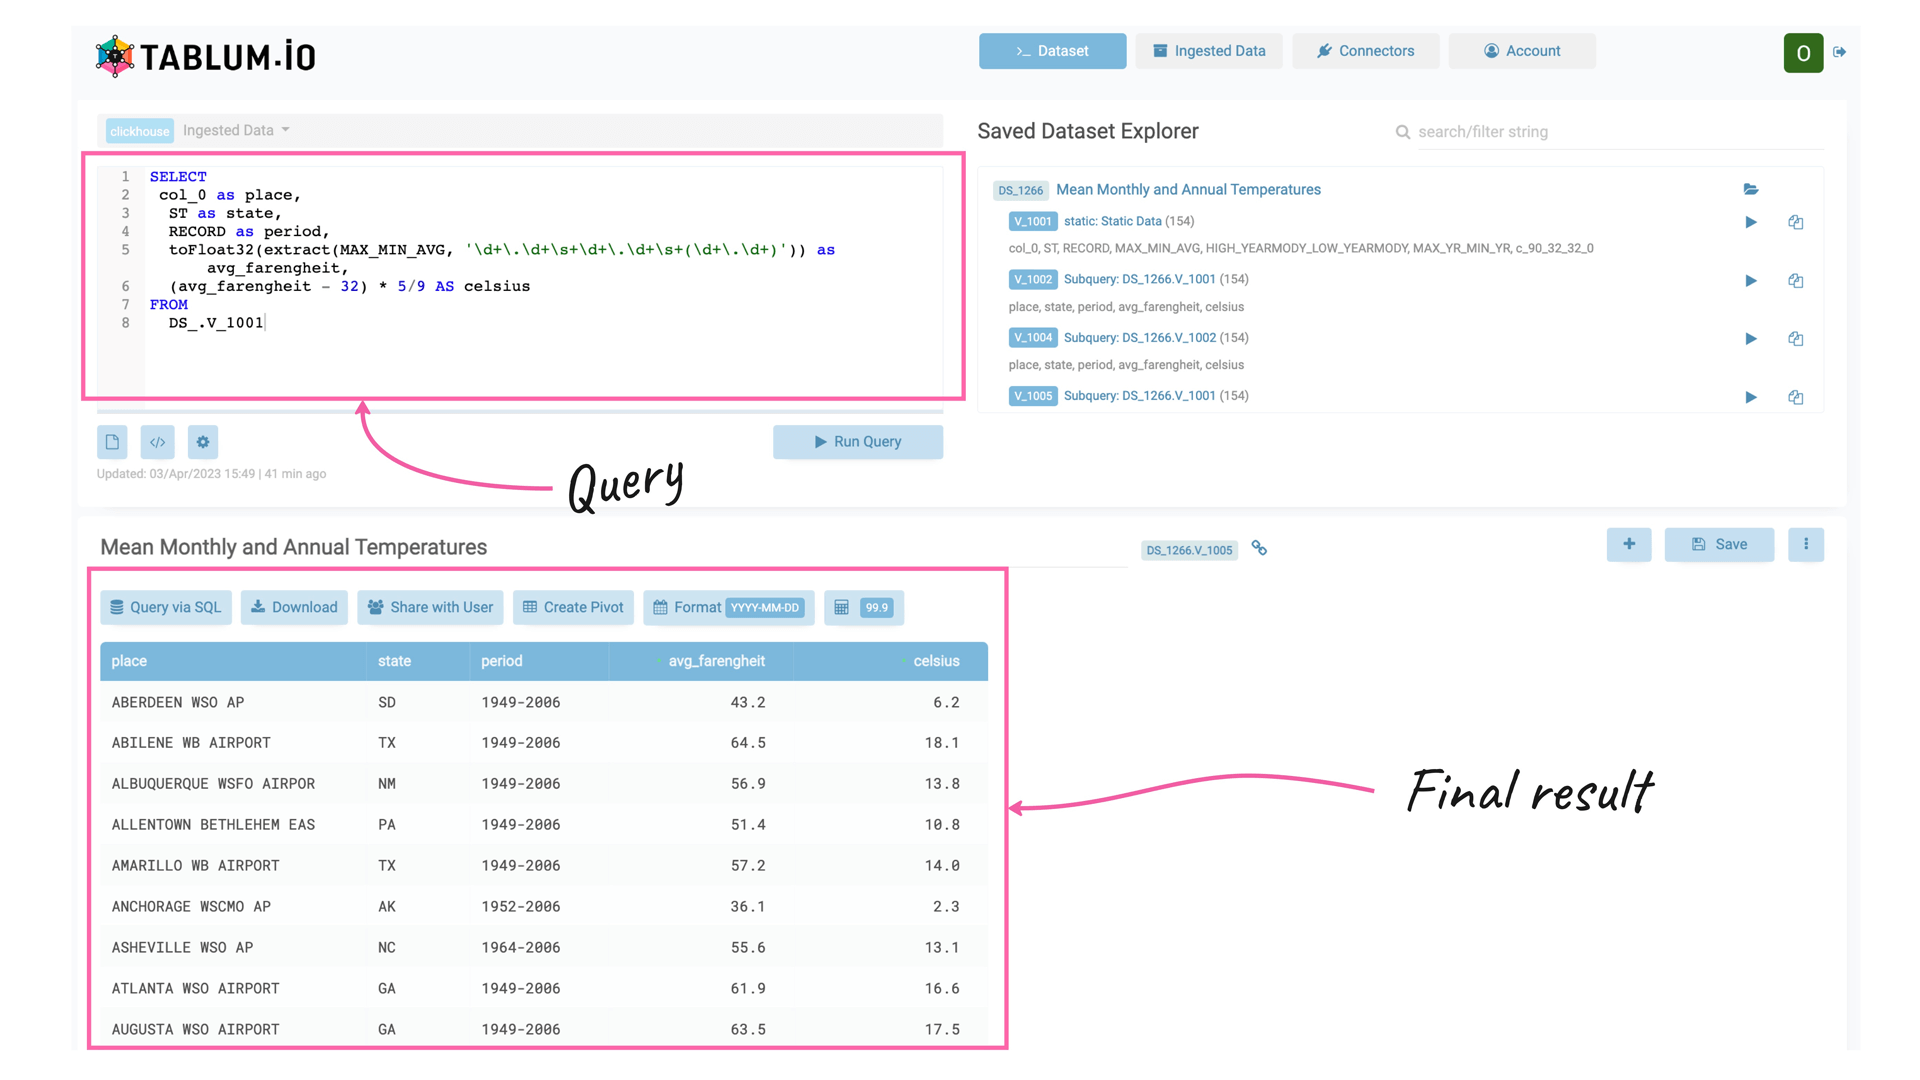
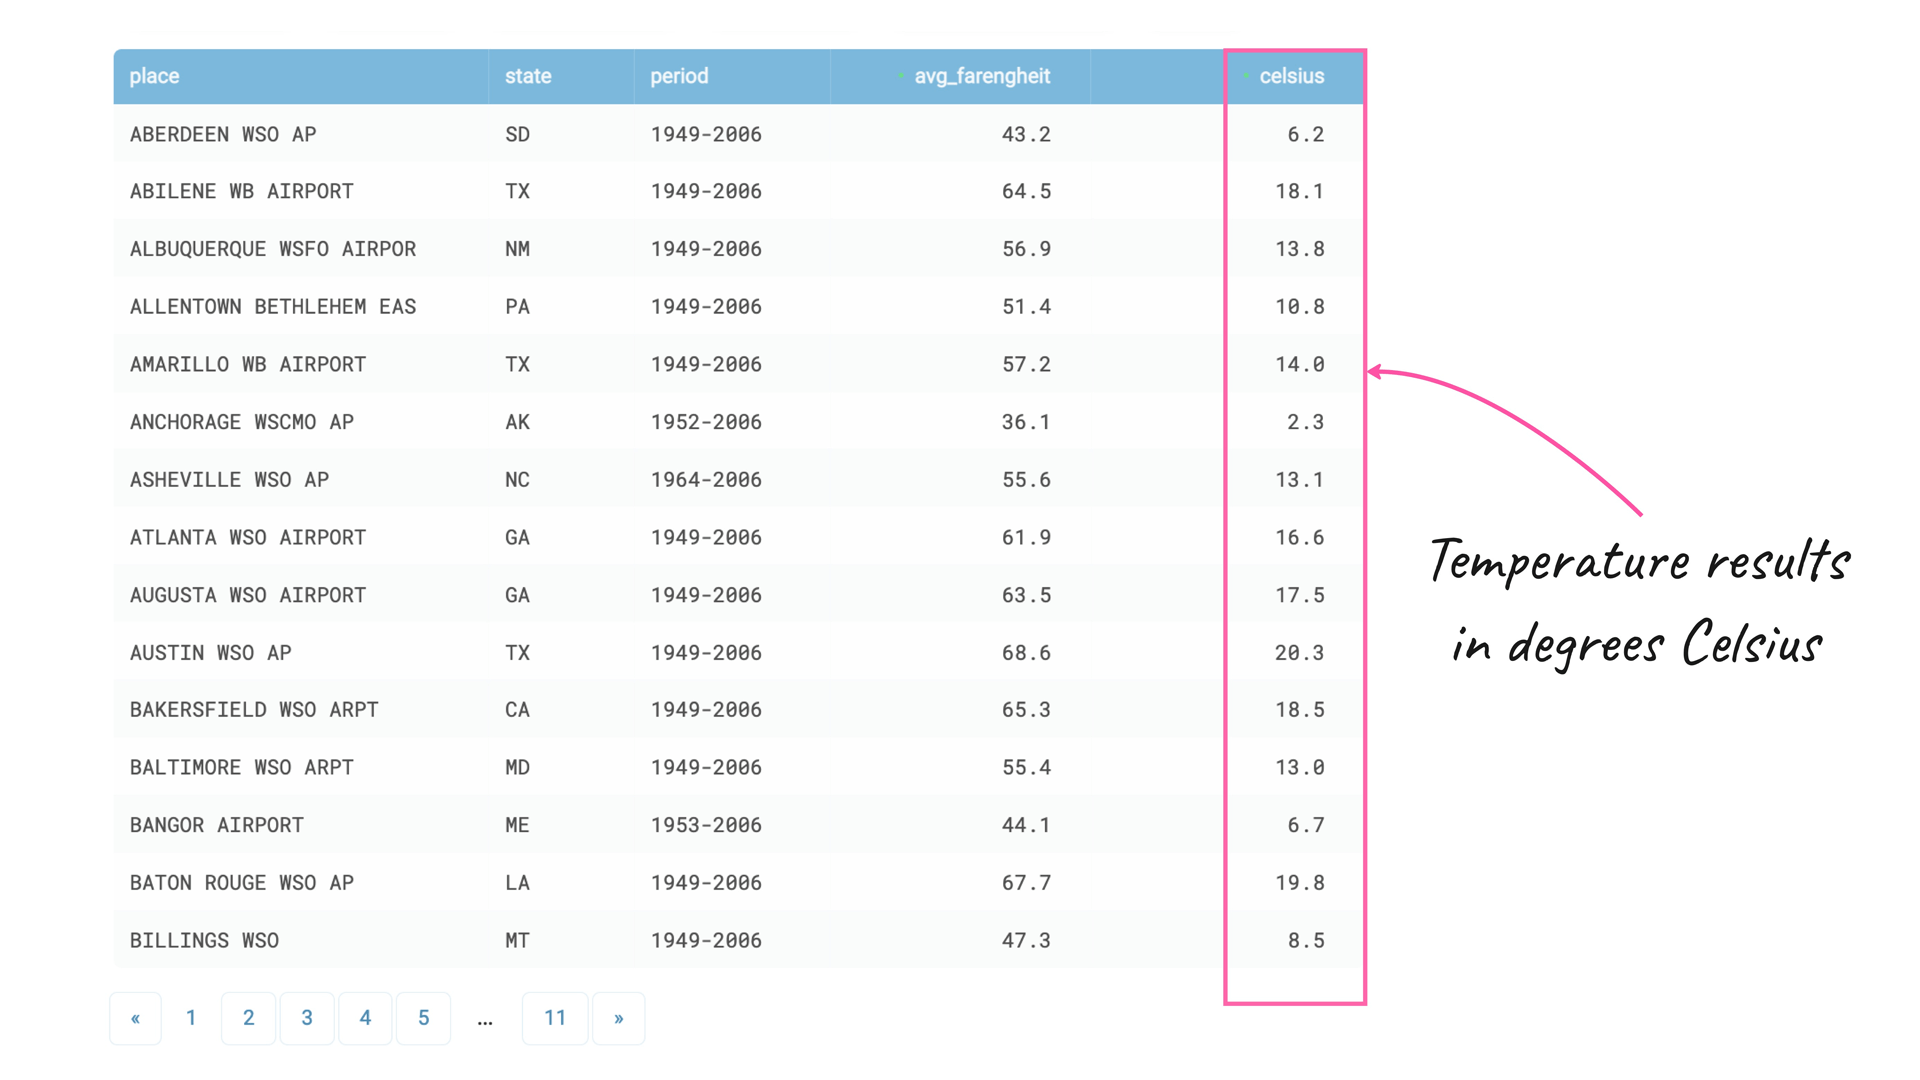
Now, the resulting SQL table has five columns, including the column with temperature values in degrees Celsius:
Step 5
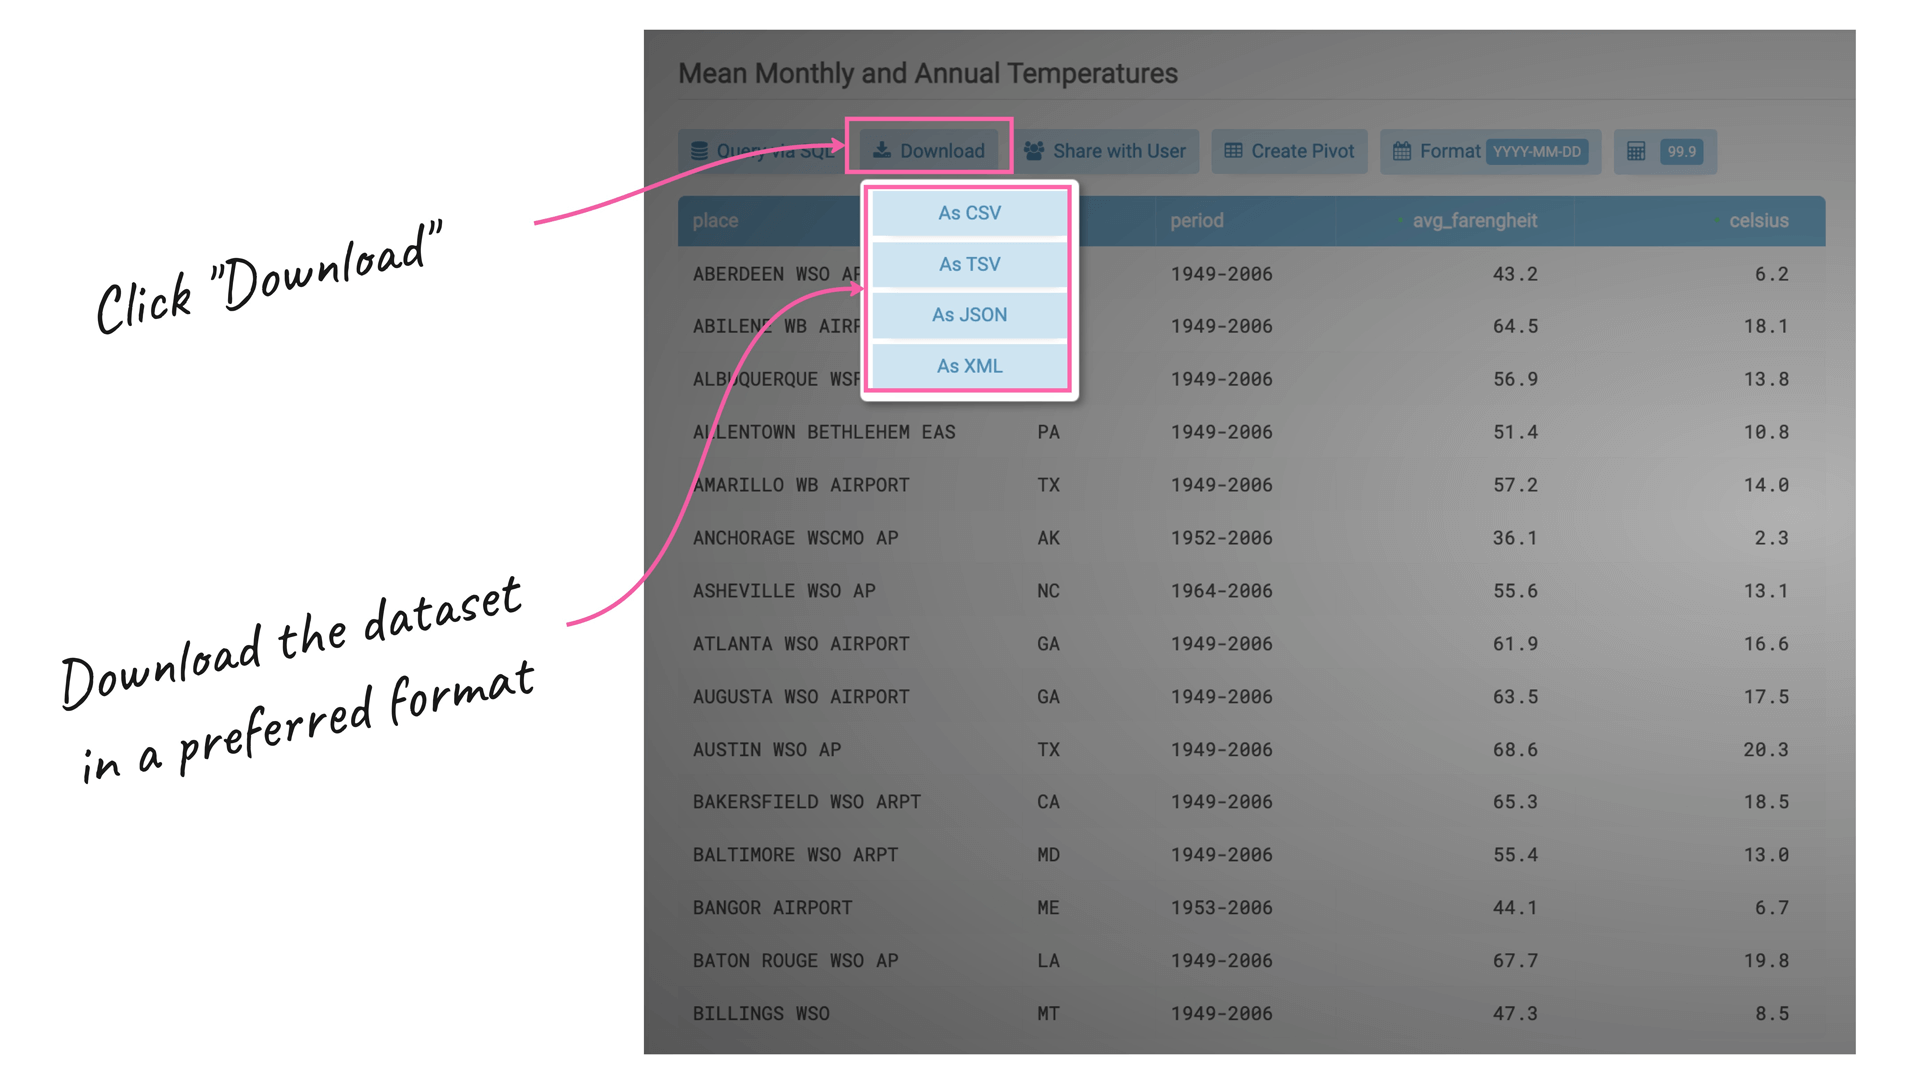
To conclude, we have successfully transformed and enhanced the original HTML table into a clean and structured dataset suitable for further analysis. To export or share the resulting dataset, we can either download it in a preferred format or use the “Enable DB Sharing” feature in the “Ingested Data” tab to access it through our favorite BI tool:
TABLUM.IO is a powerful tool that streamlines data prep tasks, improves productivity, and reduces costs for data teams. Its advanced features include automatic data transformation, data schema generation, and SQL querying, making it easy to ingest, parse, cleanse, and enhance data loaded from unstructured sources.
Next time, we're going to share with you more tips on how to make your data preparation routine more productive and pleasant.
Stay tuned :)
