This article provides an alternative way to ingest XML and JSON feeds into a SQL database and conduct ad-hoc reporting with minimal effort. As an example, we’ll examine the ranking and rating of App Store applications from the iTunes RSS feed, which will be turned into a relational database and queried using SQL.
The App Store provides an RSS feed with a list of Apps, Tracks, Books, and other entities in XML and JSON formats. However, this data is unstructured and can’t be easily analyzed. To make it more suitable for ad-hoc reporting, it needs to be ingested into a SQL database and queried with a SQL console.
Data analysts have to do a lot of tedious work to get external feed data into a SQL database. This includes using an HTTP client to fetch the feed content, parsing it into a structured form, cleaning and transforming the nested structure into a 2-D array, setting up a database, and creating a table with a schema that matches the feed content or specific fields from it. All of this is necessary to make sure that the data is ready for analysis and requires either a combination of tools and services or scripting in Python.
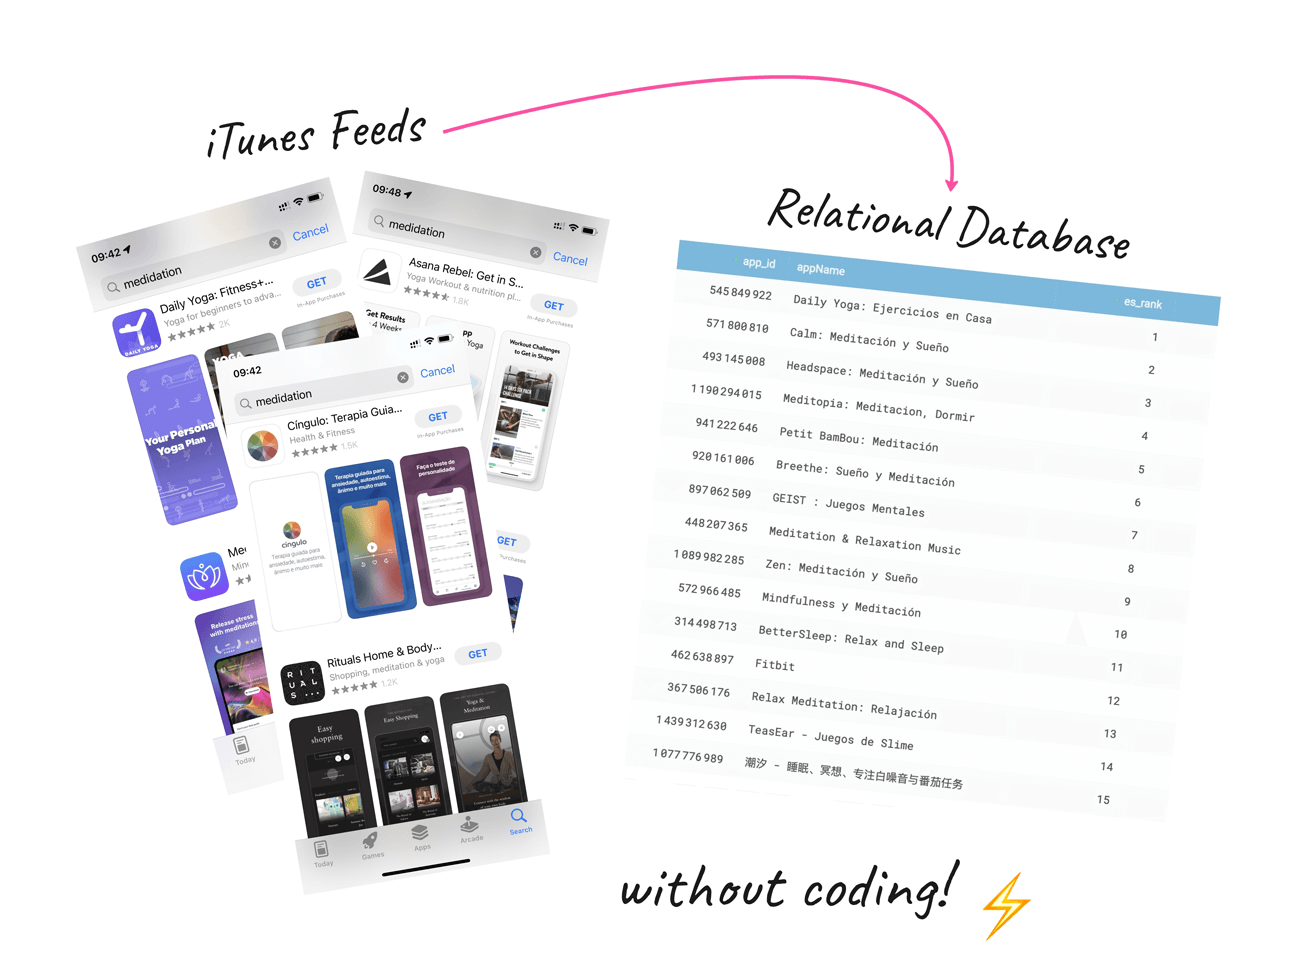
However, there is a simpler way that can save time and make the process more enjoyable. In this post, I’ll show you how to quickly get external feed data into a SQL database without writing a single line of code. To demonstrate, I will be using iTunes feed to compare the top apps in the “meditation” category by their rankings and ratings in two countries of my interest — Spain and Portugal.
The App Store provides an RSS feed with a list of Apps, Tracks, Books, and other entities in XML and JSON formats. However, this data is unstructured and can’t be easily analyzed. To make it more suitable for ad-hoc reporting, it needs to be ingested into a SQL database and queried with a SQL console.
Data analysts have to do a lot of tedious work to get external feed data into a SQL database. This includes using an HTTP client to fetch the feed content, parsing it into a structured form, cleaning and transforming the nested structure into a 2-D array, setting up a database, and creating a table with a schema that matches the feed content or specific fields from it. All of this is necessary to make sure that the data is ready for analysis and requires either a combination of tools and services or scripting in Python.
However, there is a simpler way that can save time and make the process more enjoyable. In this post, I’ll show you how to quickly get external feed data into a SQL database without writing a single line of code. To demonstrate, I will be using iTunes feed to compare the top apps in the “meditation” category by their rankings and ratings in two countries of my interest — Spain and Portugal.
Data Source
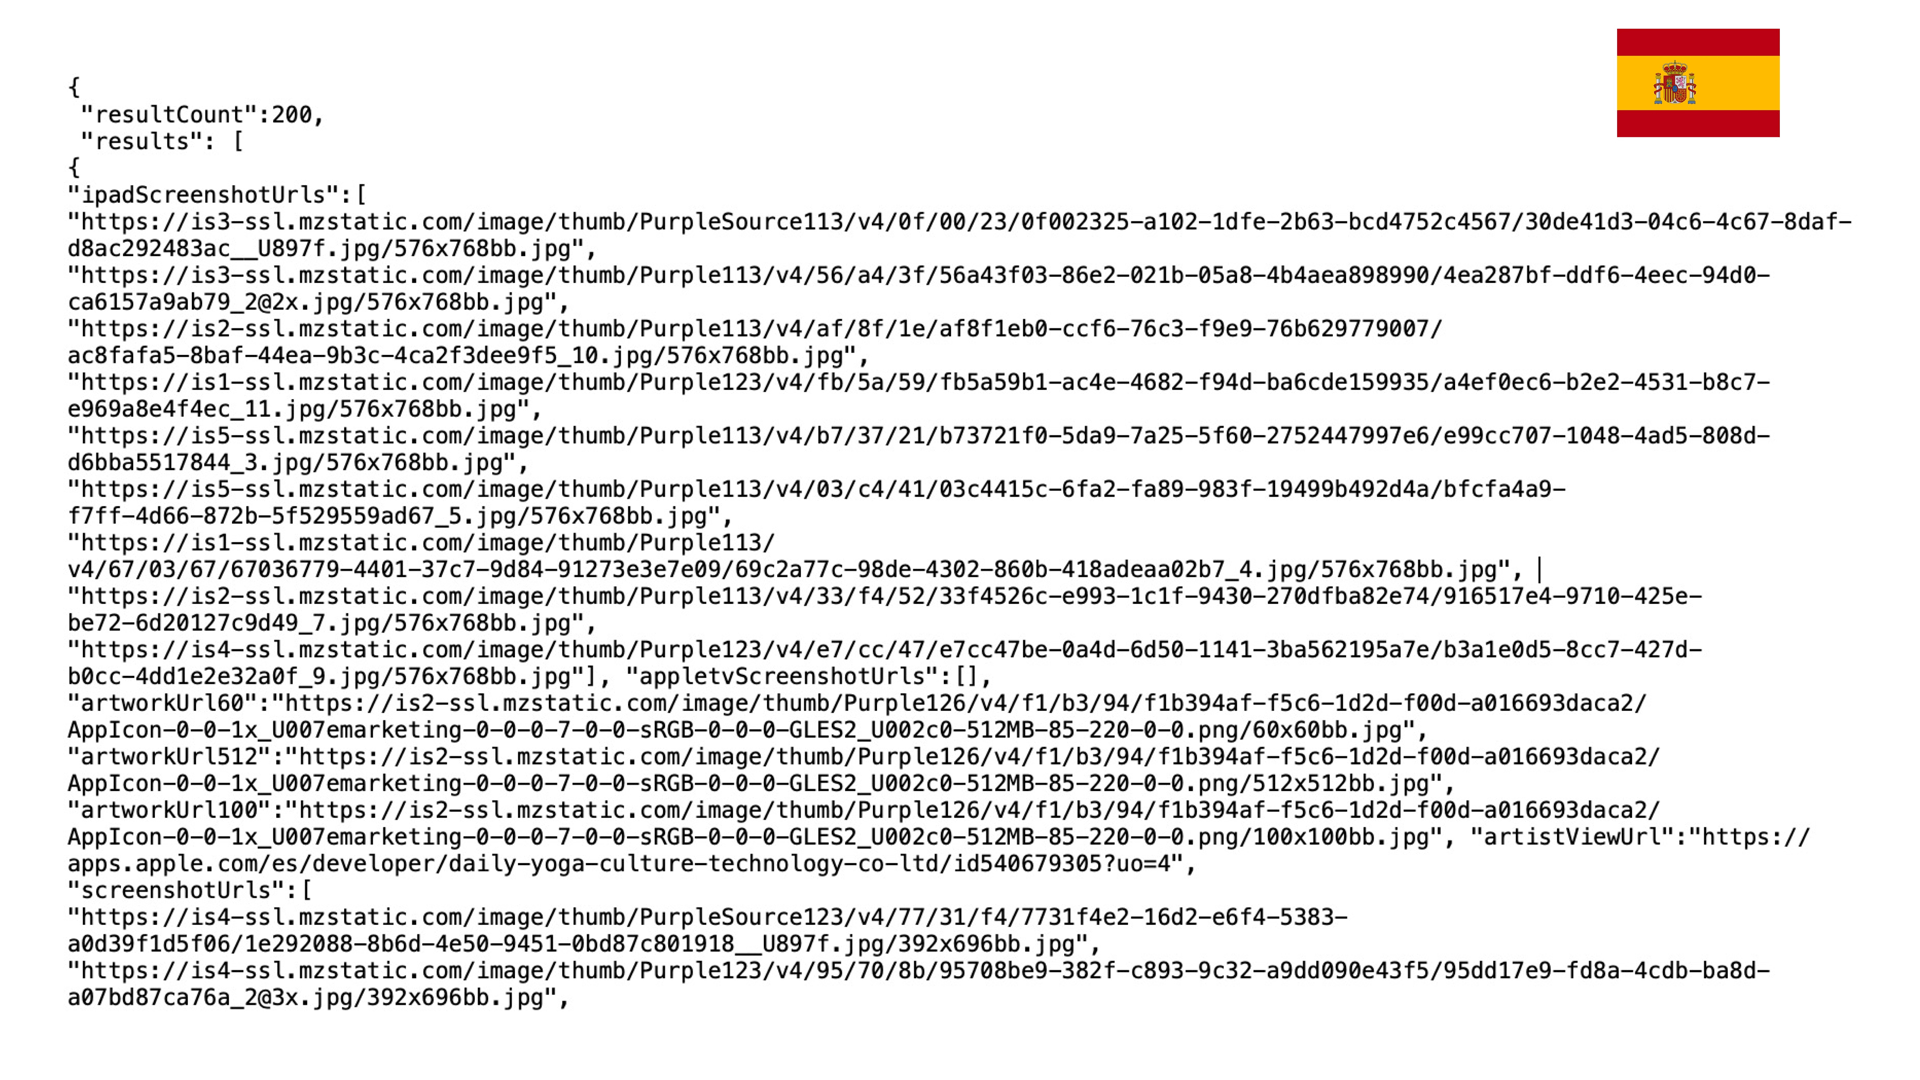
I found a publicly available iTunes feed on the internet that returns a JSON output containing a list of up to 200 apps for the search term, e.g. “meditation”. You’re able to fetch the list for specific country by adding the “&country=” parameter. This way, you can get up to 200 results for each country the app is available in.
For TOP-200 apps in Spain: https://itunes.apple.com/search?term=meditation&entity=software&limit=200&country=ES
For TOP-200 apps in Spain: https://itunes.apple.com/search?term=meditation&entity=software&limit=200&country=ES
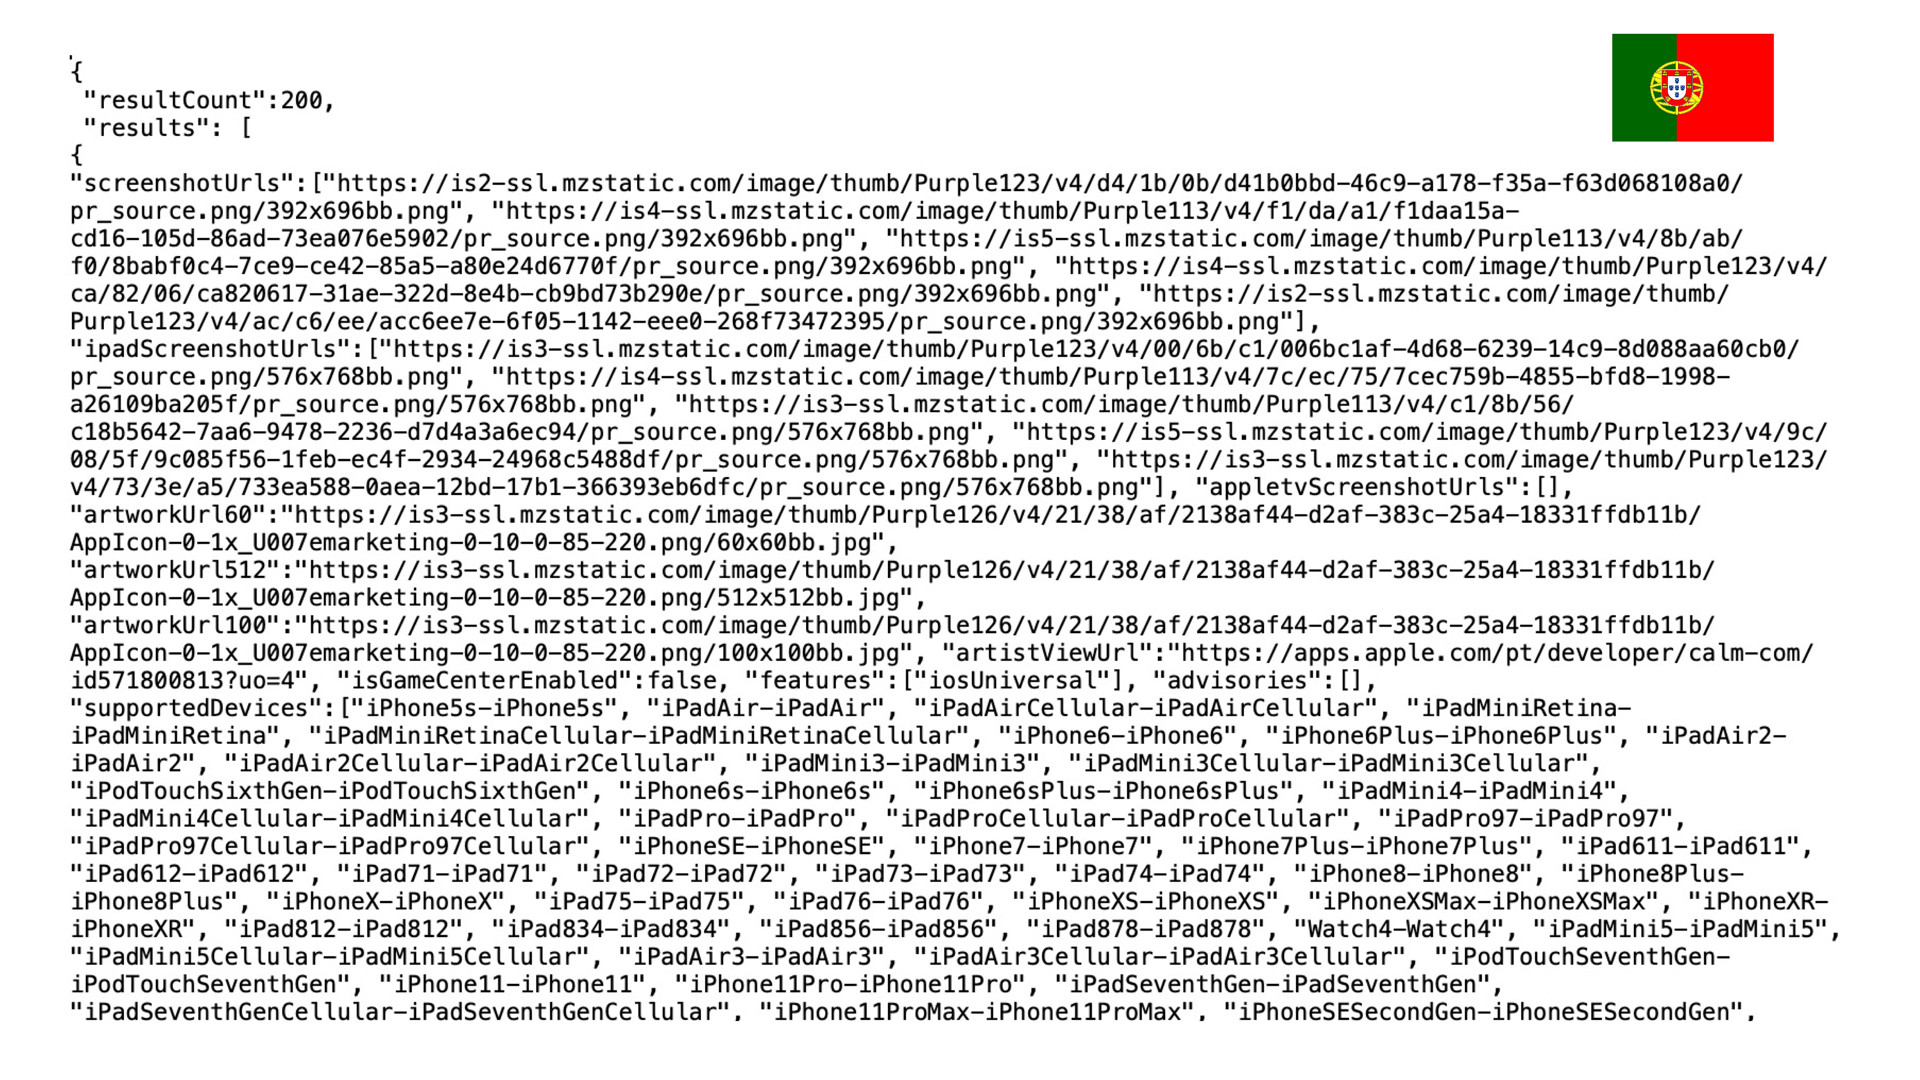
For TOP-200 apps in Portugal: https://itunes.apple.com/search?term=meditation&entity=software&limit=200&country=PT
Getting Data Ready for Analysis
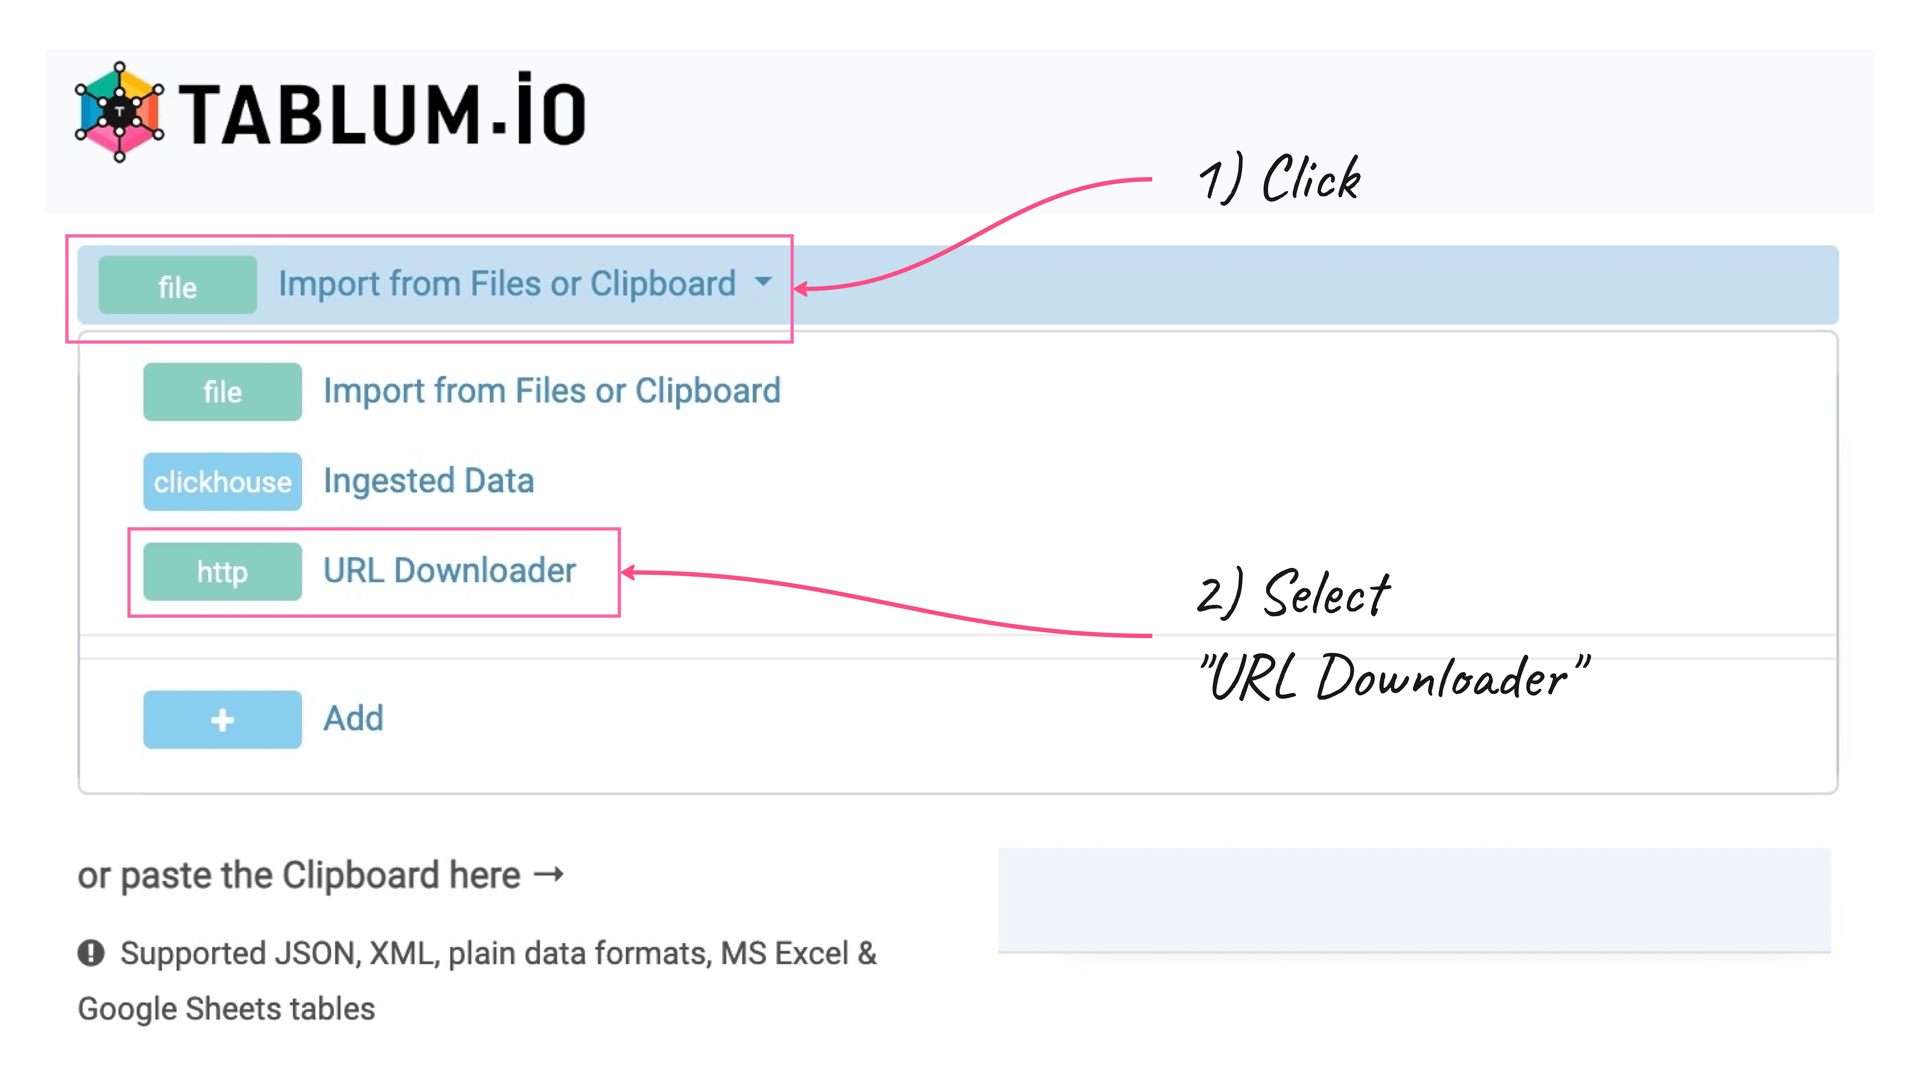
I use TABLUM.IO to quickly load data from CSV, XML, and JSON files, and get the data instantly ready for ad-hoc reporting.
How it works
{$te}
Spain (View #1)
I’ll use the following URL and parameters to fetch data:
It will return dozens of fields for each app. So I’m going to provide extra parameters to the “URL Downloader” to specify the columns I need to keep in the resulting output:
cols="trackId,trackName,averageUserRating,userRatingCount,averageUserRatingForCurrentVersion,userRatingCountForCurrentVersion"
I will end up with:
- trackId — App ID (can be used in a request for getting a list of comments),
- trackName — App’s name,
- averageUserRating — the average user rating (by country),
- userRatingCount — the number of user ratings an app has received,
- averageUserRatingforCurrentVersion — average user rating for the current app version,
- userRatingCountForCurrentVersion — the total number of ratings submitted by users for the current version of the app.
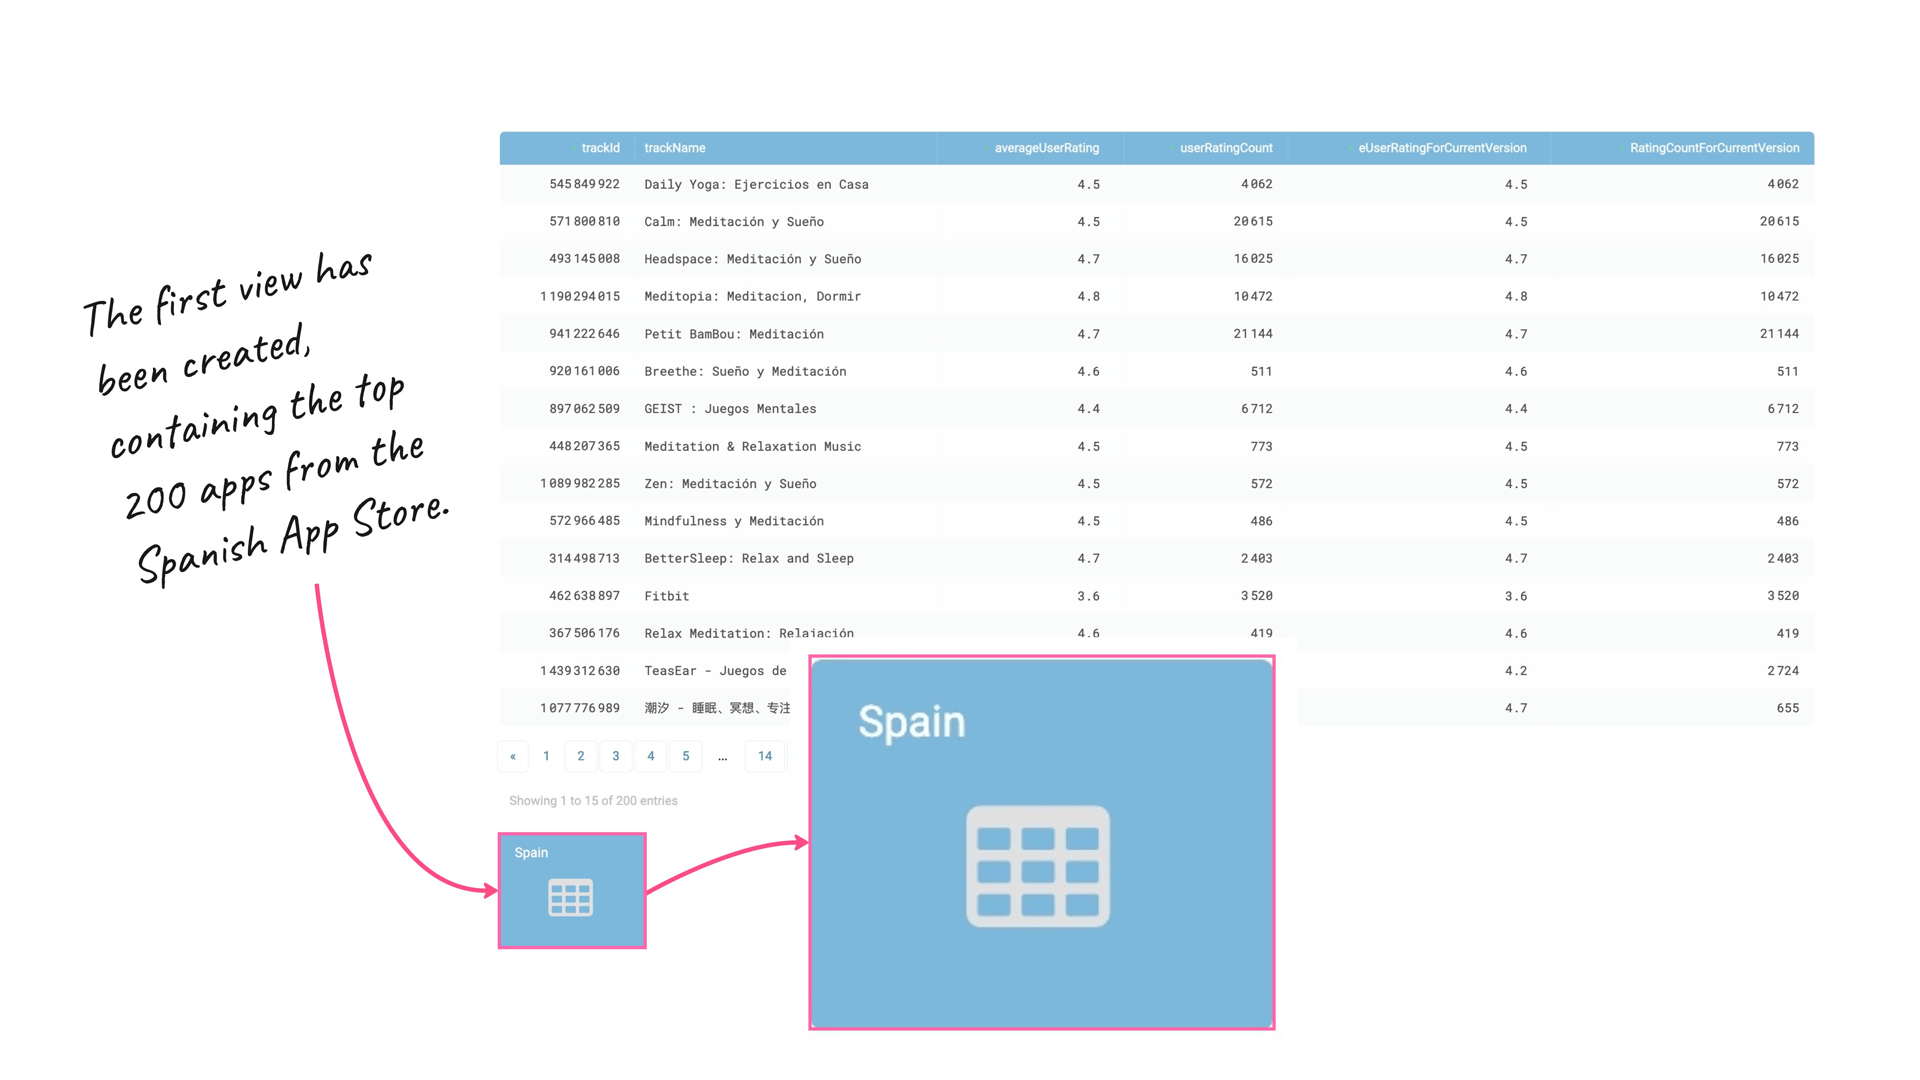
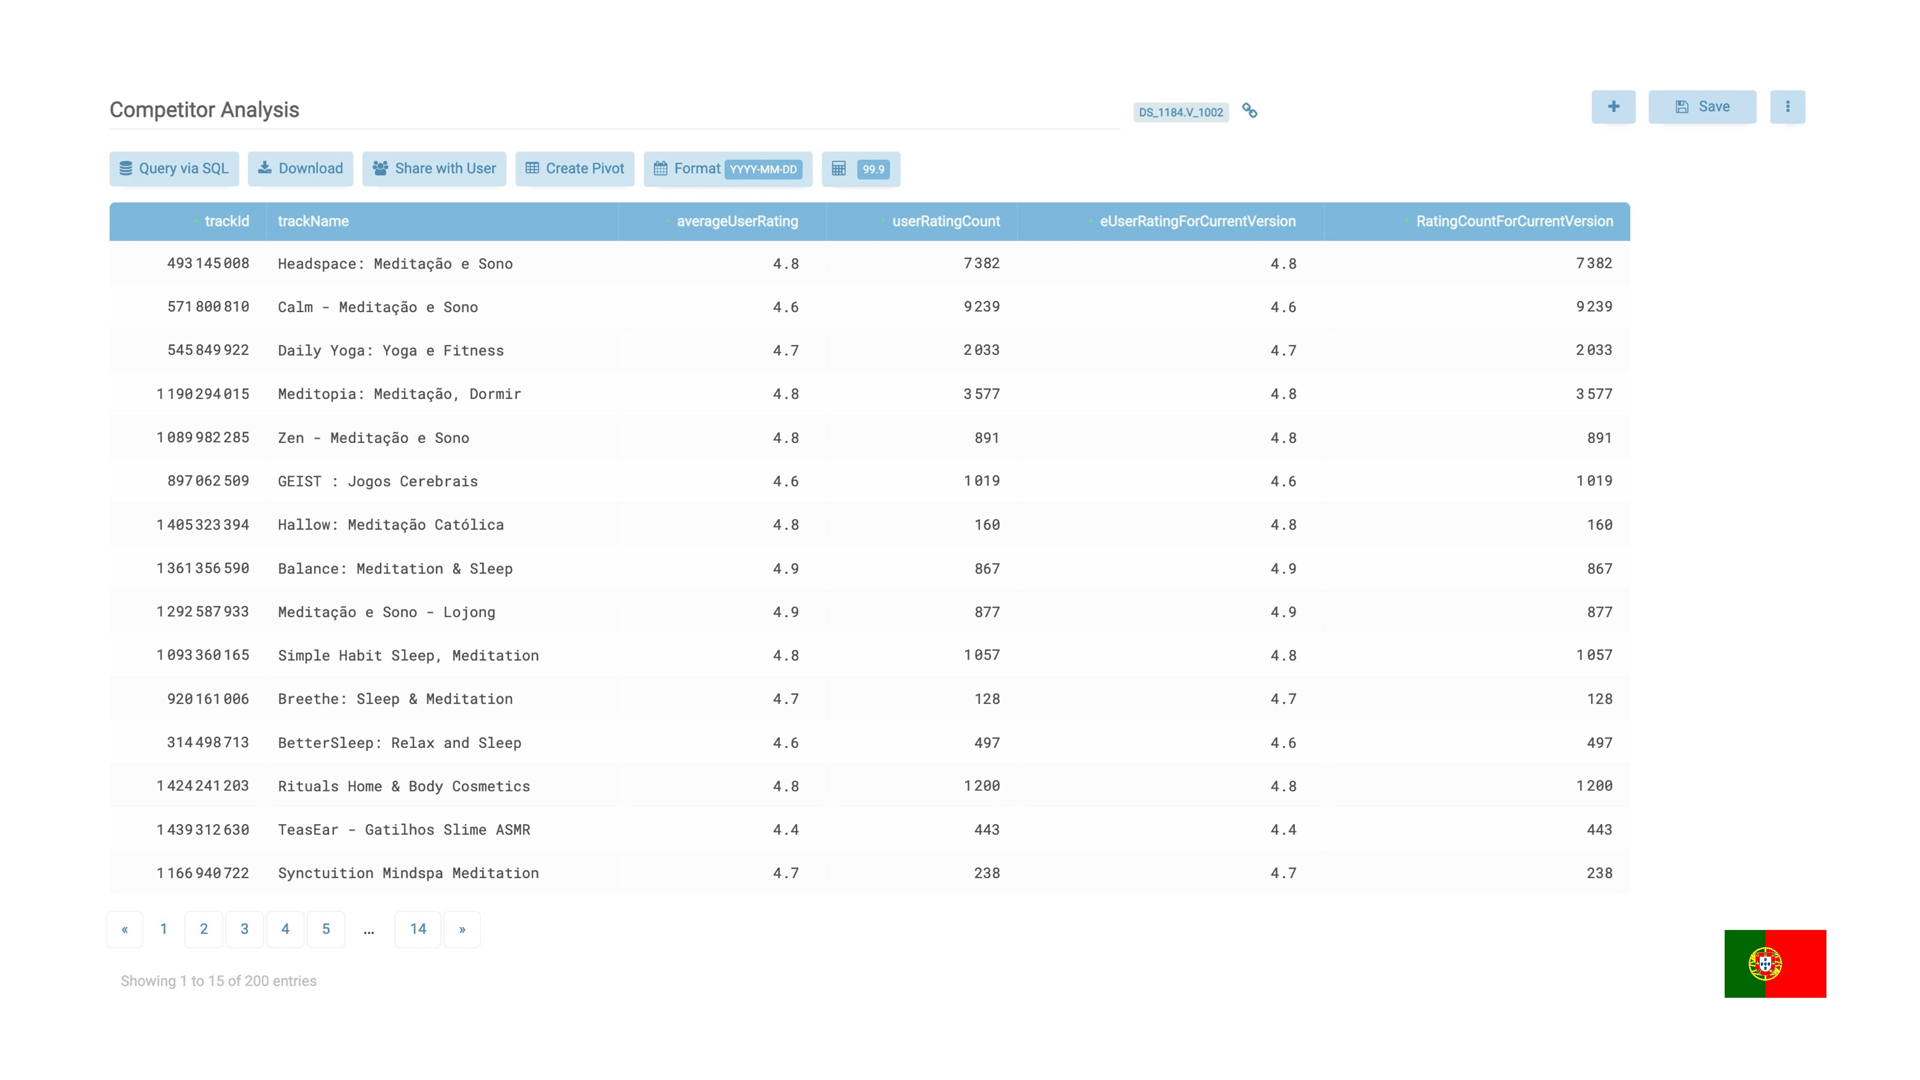
TABLUM.IO returns a SQL table with the top 200 most popular meditation apps from the Spanish App Store:

At the bottom of the page, you can now see a blue rectangle. This is the View #1 (think of it as a “tab” in GoogleSheets) for the top-200 meditation apps in Spain:
Portugal (View #2)
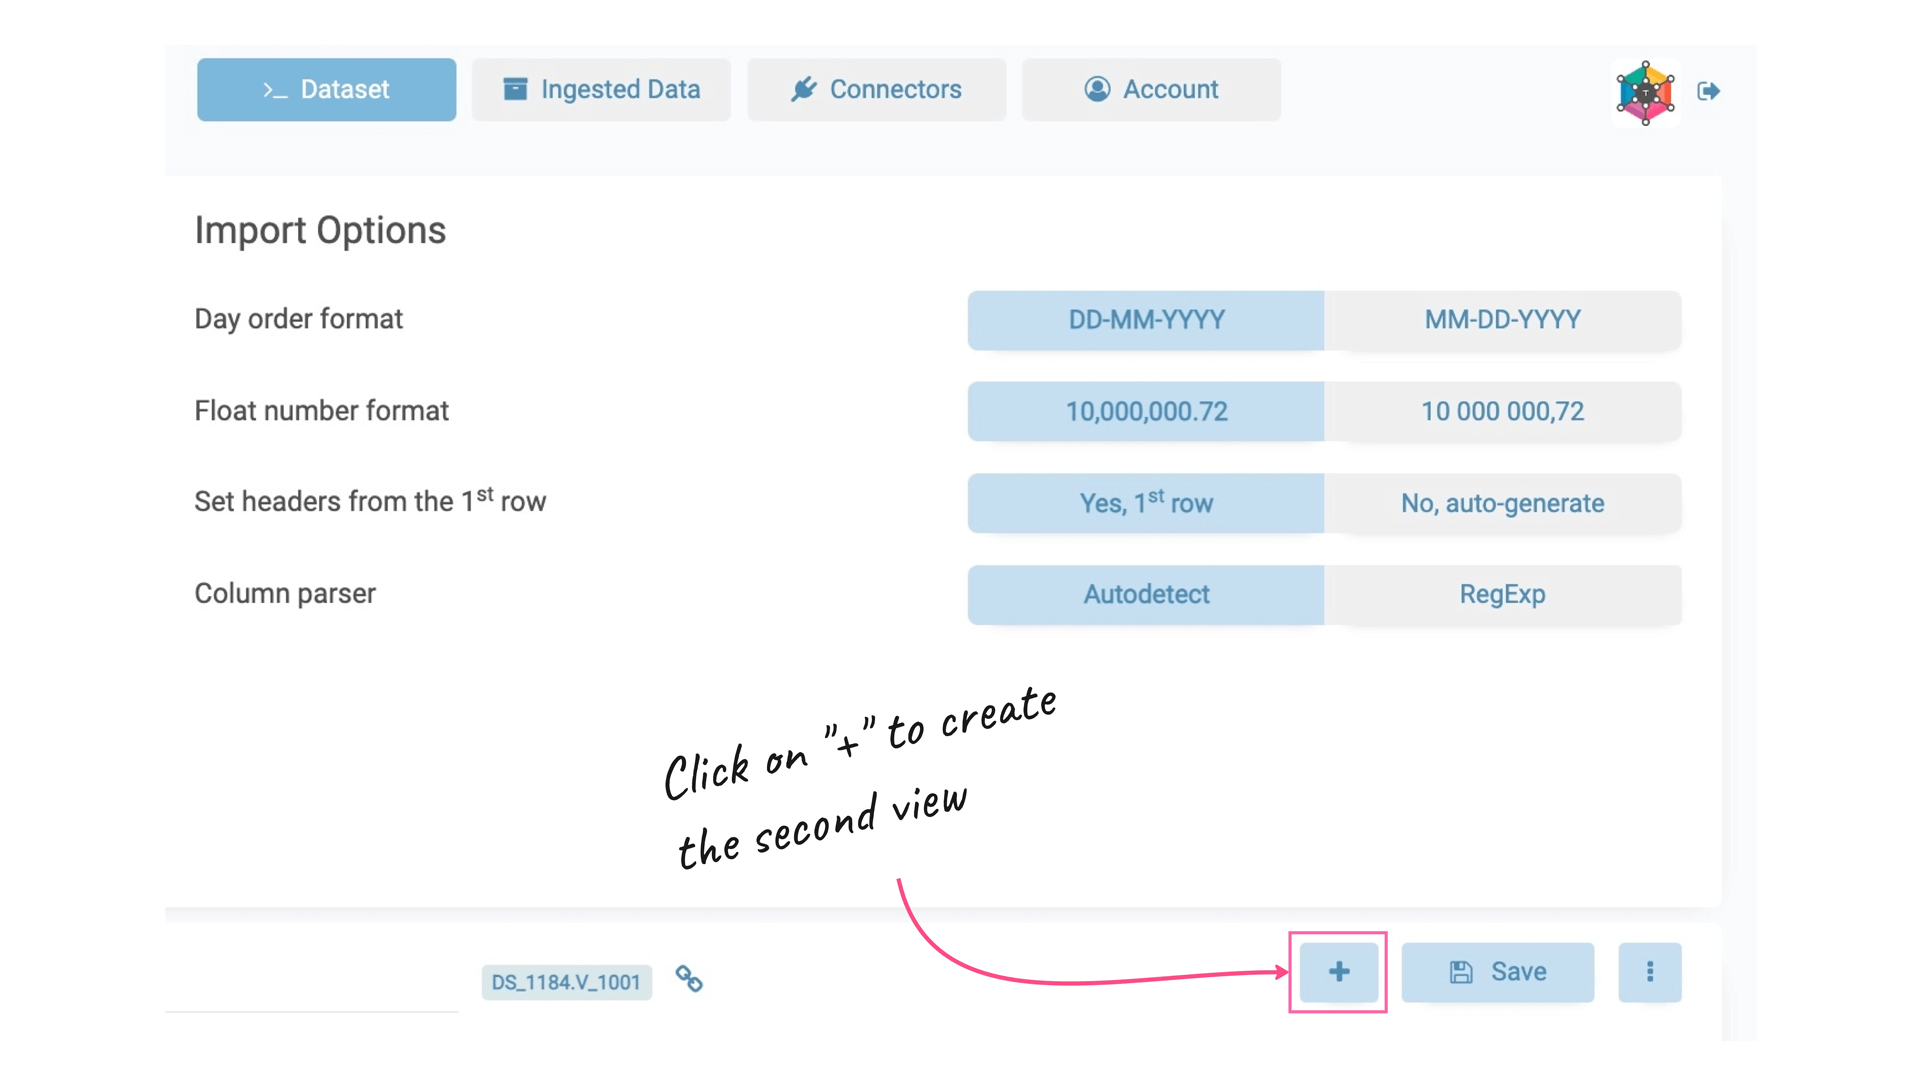
Now we are going to create the second view with Portiguese top 200 apps same way we did for Spanish feed. Click the “+” button to create a new View:
Insert the URL, set the filter parameters for columns to return, and click the “Run Query” button:
https://itunes.apple.com/search?term=meditation&entity=software&limit=200&country=PT
cols="trackId,trackName,averageUserRating,userRatingCount,averageUserRatingForCurrentVersion,userRatingCountForCurrentVersion"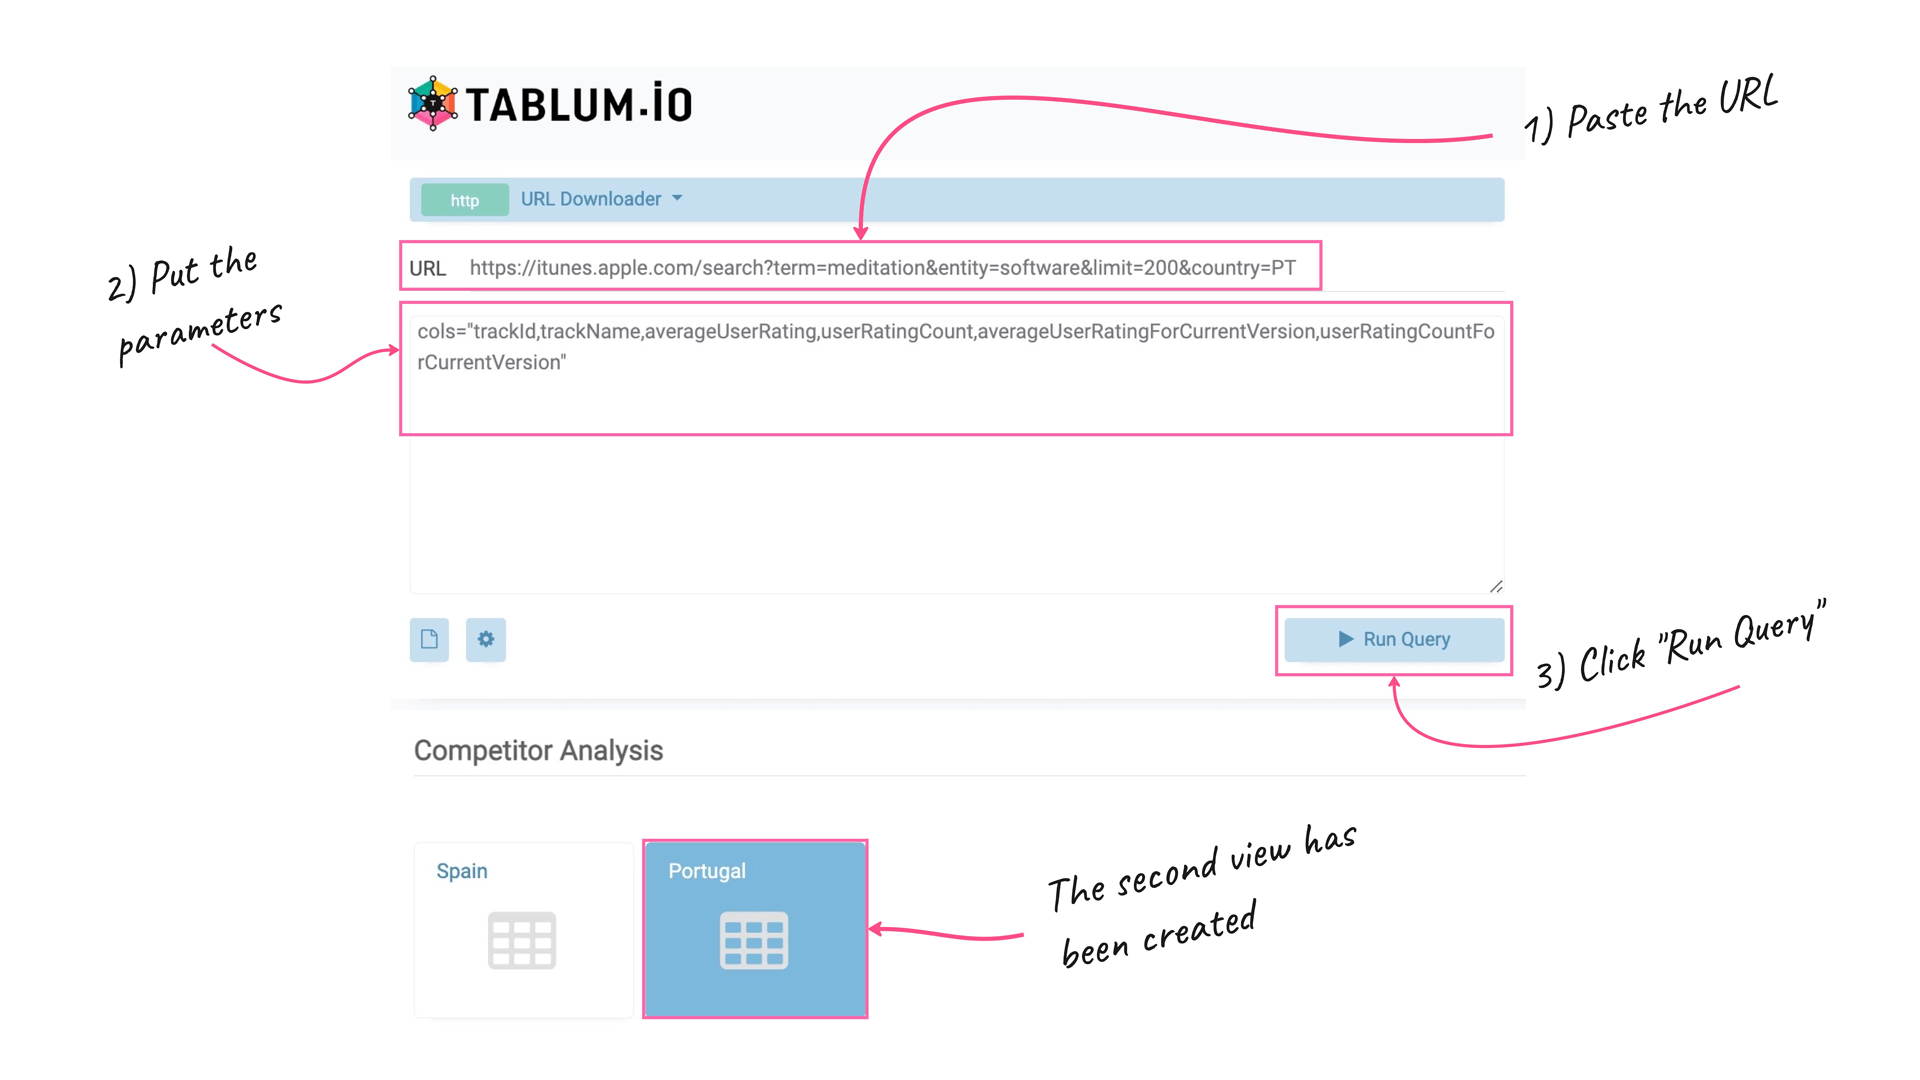
Here we’ve got the TOP-200 apps from the “meditation” category in Portugal:
Spain+Portugal, “Joined” data (View #3)
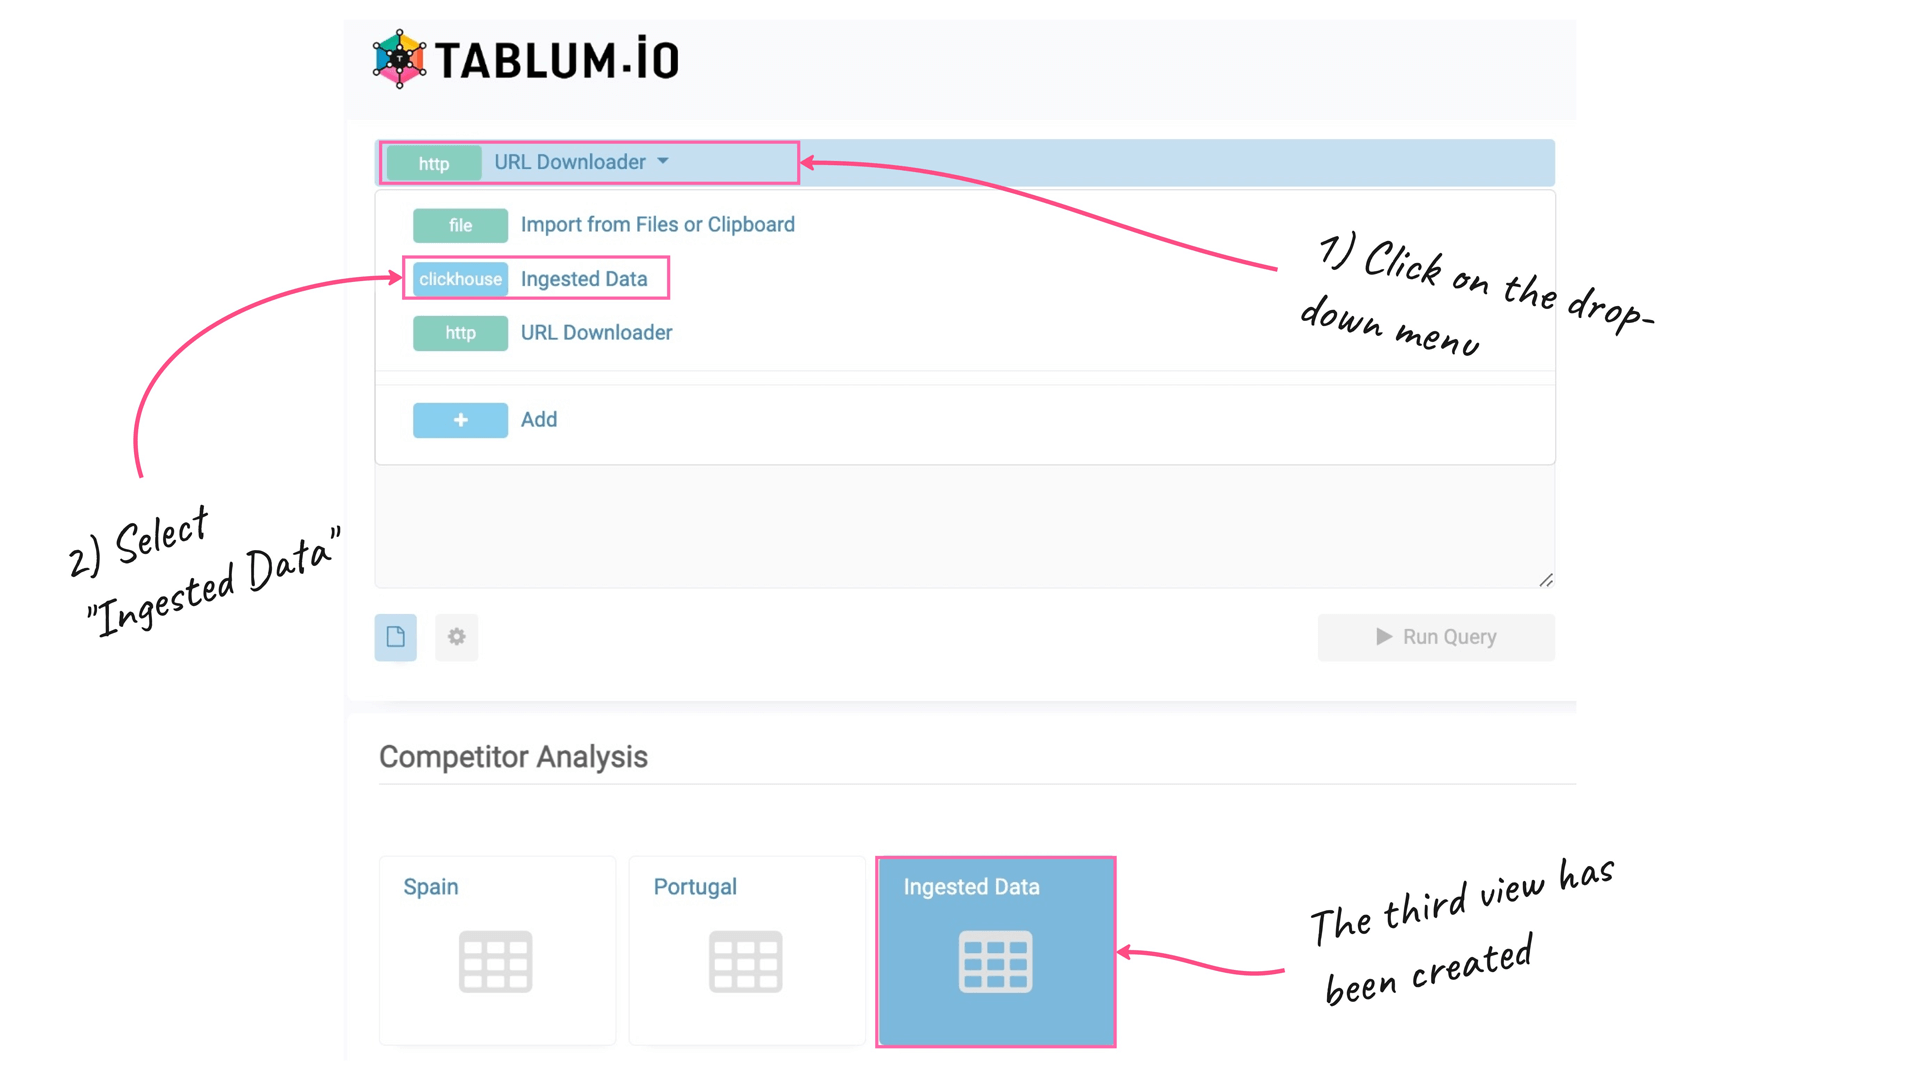
Now we’re going to create the third view with an “Ingested Data” type so we could qeury results from already ingested data via SQL commands.
Click the “+” button to create a new View, as we did before. Then, from the drop-down menu select the “Ingested Data” item to be able to query joined data from both View 1 and View 2:
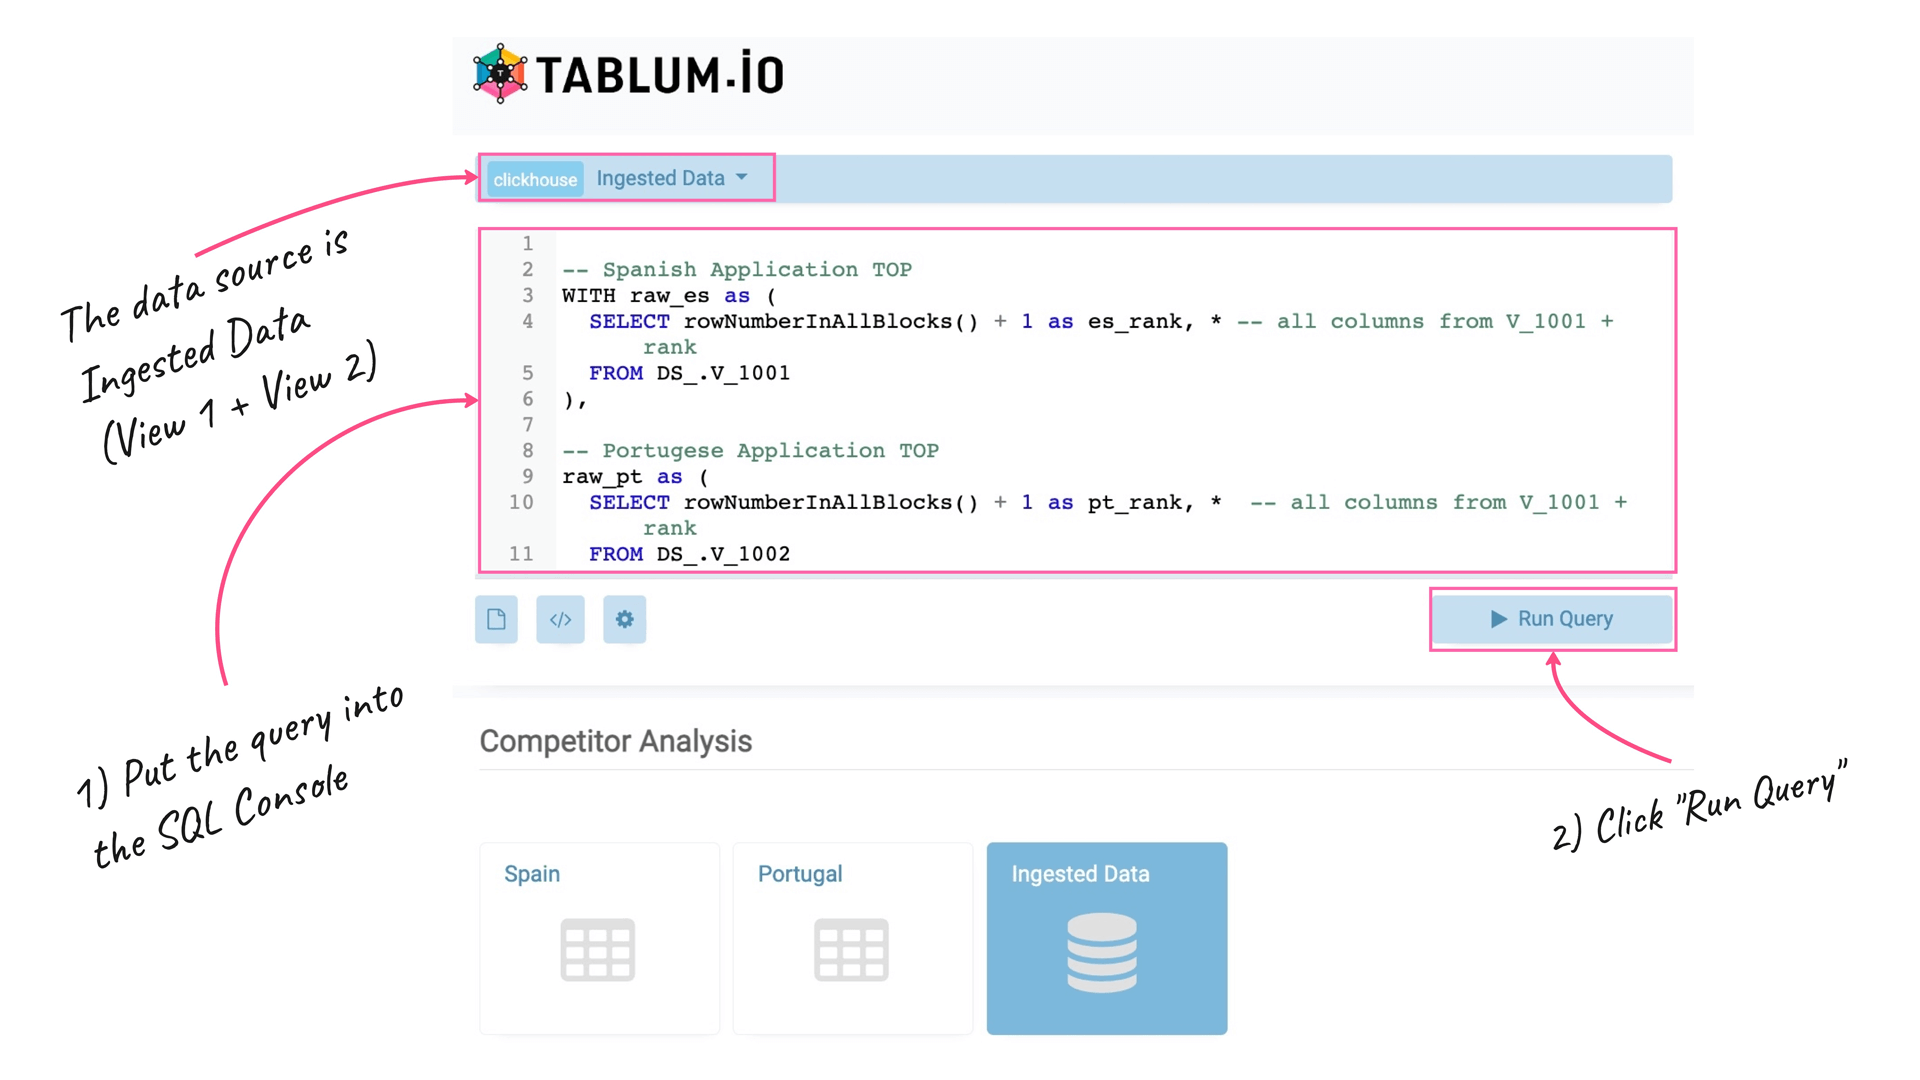
I’ll put the following query into the SQL Console to do this:
-- Spanish Application TOP
WITH raw_es as (
  SELECT rowNumberInAllBlocks() + 1 as es_rank, * -- all columns from V_1001 + rank
  FROM DS_.V_1001
),

-- Portugese Application TOP
raw_pt as (
  SELECT rowNumberInAllBlocks() + 1 as pt_rank, *  -- all columns from V_1001 + rank
  FROM DS_.V_1002
)

-- Mix them together by their app_id and calculate the diff in rate
SELECT trackId as app_id,
       trackName as appName,
       es_rank,
       pt_rank,
       es_rank - pt_rank as rank_diff,
       averageUserRating as es_rating,
       raw_pt.averageUserRating as pt_rating,
       es_rating - pt_rating as rating_diff
FROM raw_es
INNER JOIN raw_pt
ON raw_es.trackId = raw_pt.trackId
As a side note: when the data gets imported by TABLUM.IO, it becomes a ClickHouse SQL table. So any further queries to the ingested data is done using ClickHouse SQL syntax.
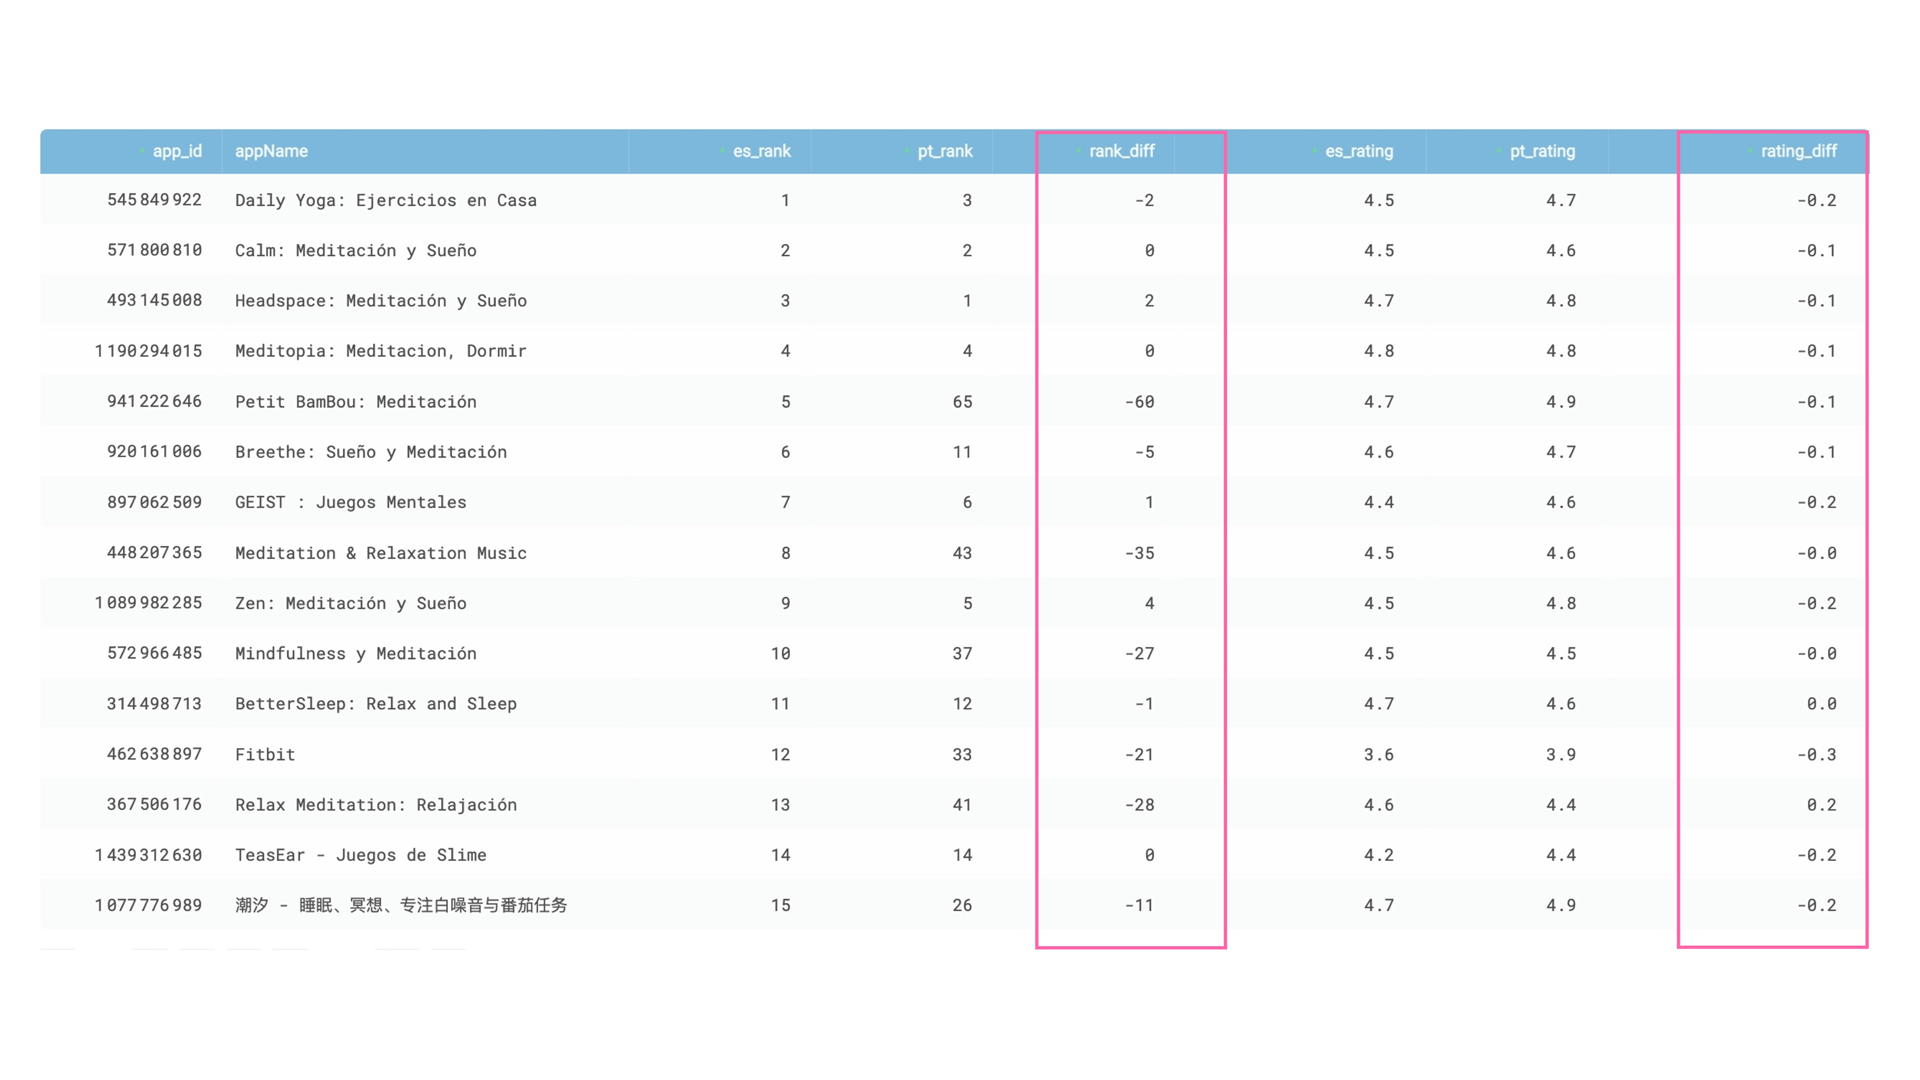
The output results will contain the following set of columns:
- app_id
- appName — App’s name,
- es_rank—App’s ranking in the Spanish App Store,
- pt_rank — App’s ranking in the Portuguese App Store,
- rank_diff — the difference between app’s ranking in Spain and Portugal,
- es_ratnig — App’s rating in the Spanish App Store,
- pt_ratnig — App’s rating in the Portuguese App Store,
- rating_diff — the difference between app’s rating in Spain and Portugal.
This query produces a final SQL table that shows the difference in ranking and rating for the same apps between Spanish and Portuguese. It is based on data from both View 1 and View 2, which are enriched with rankings and joined by application ID from the App Store:
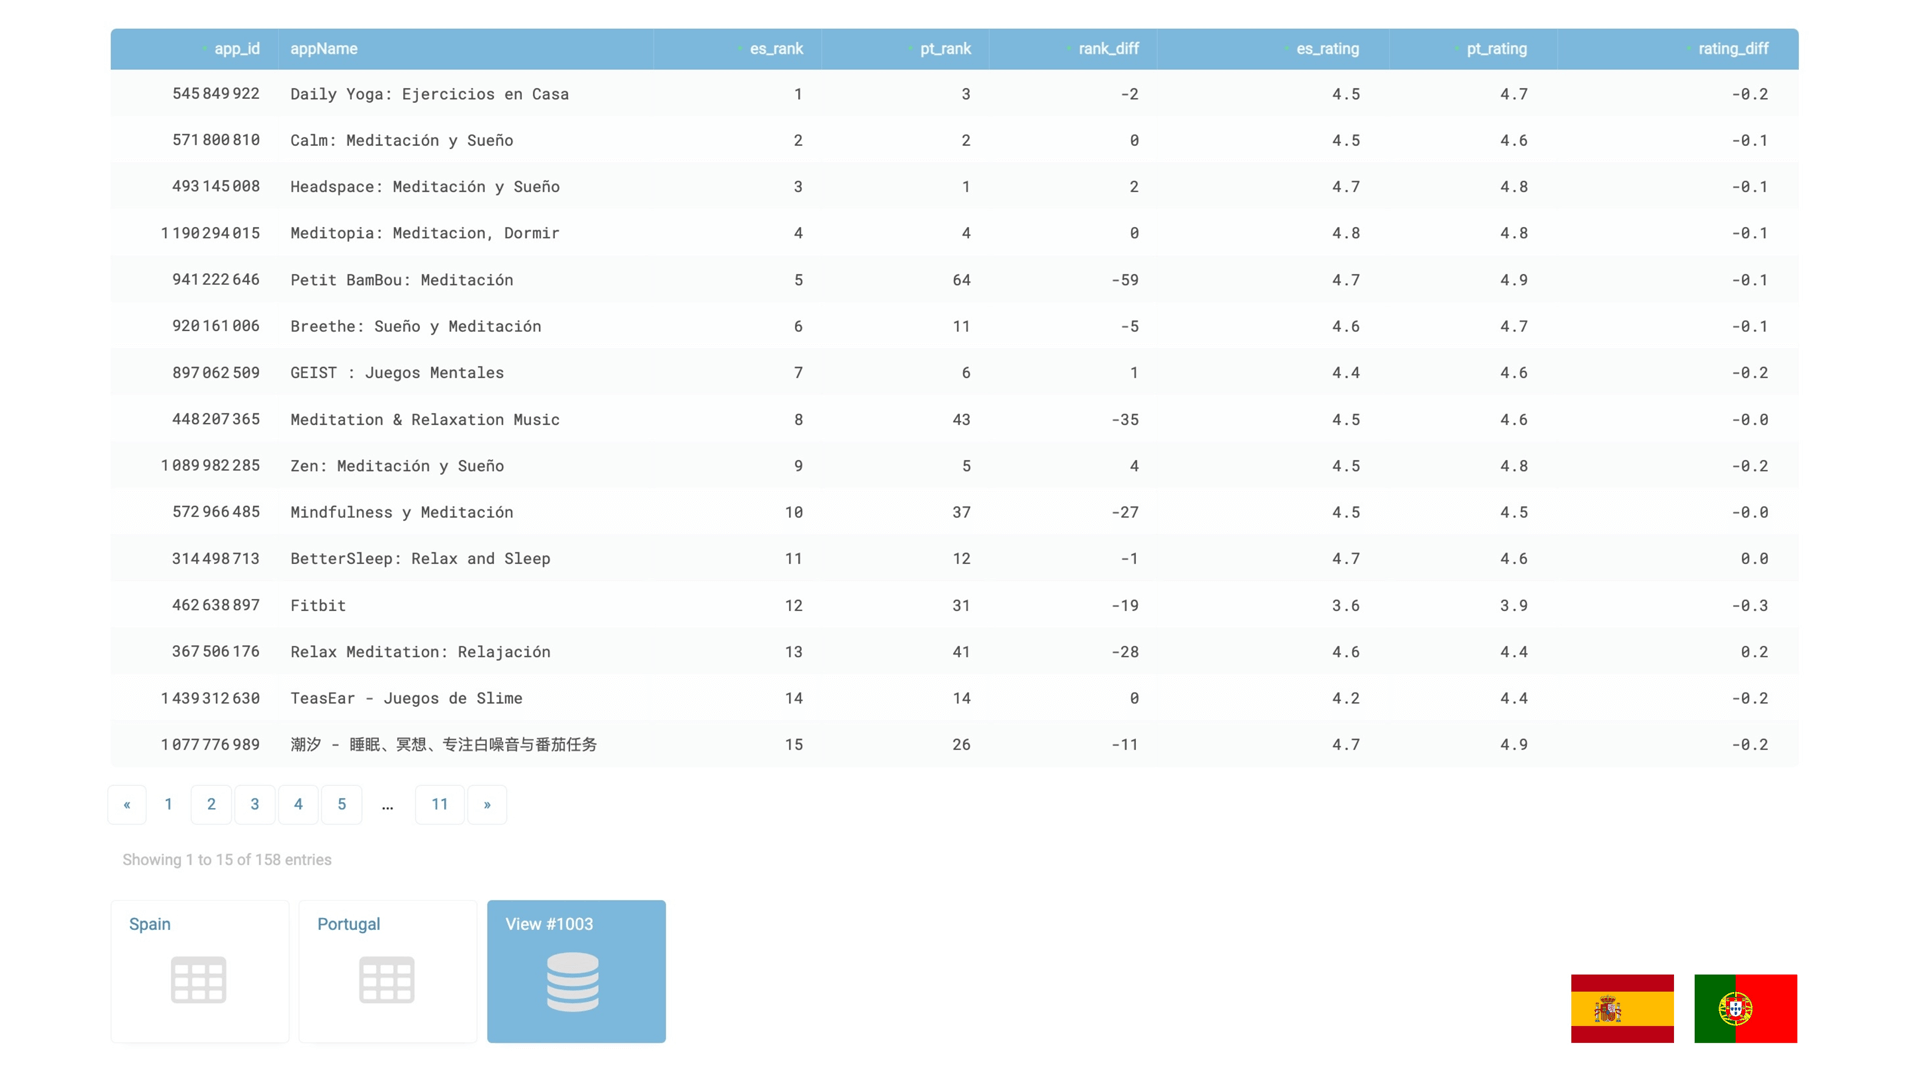
Result
I ingested the iTunes feed to create a SQL table that is ready for ad-hoc reporting and further manipulation. By comparing the top apps in the “meditation” category, I was able to identify the differences in rankings and ratings between Spanish and Portuguese App Stores. The third and sixth columns of the table illustrate this difference.