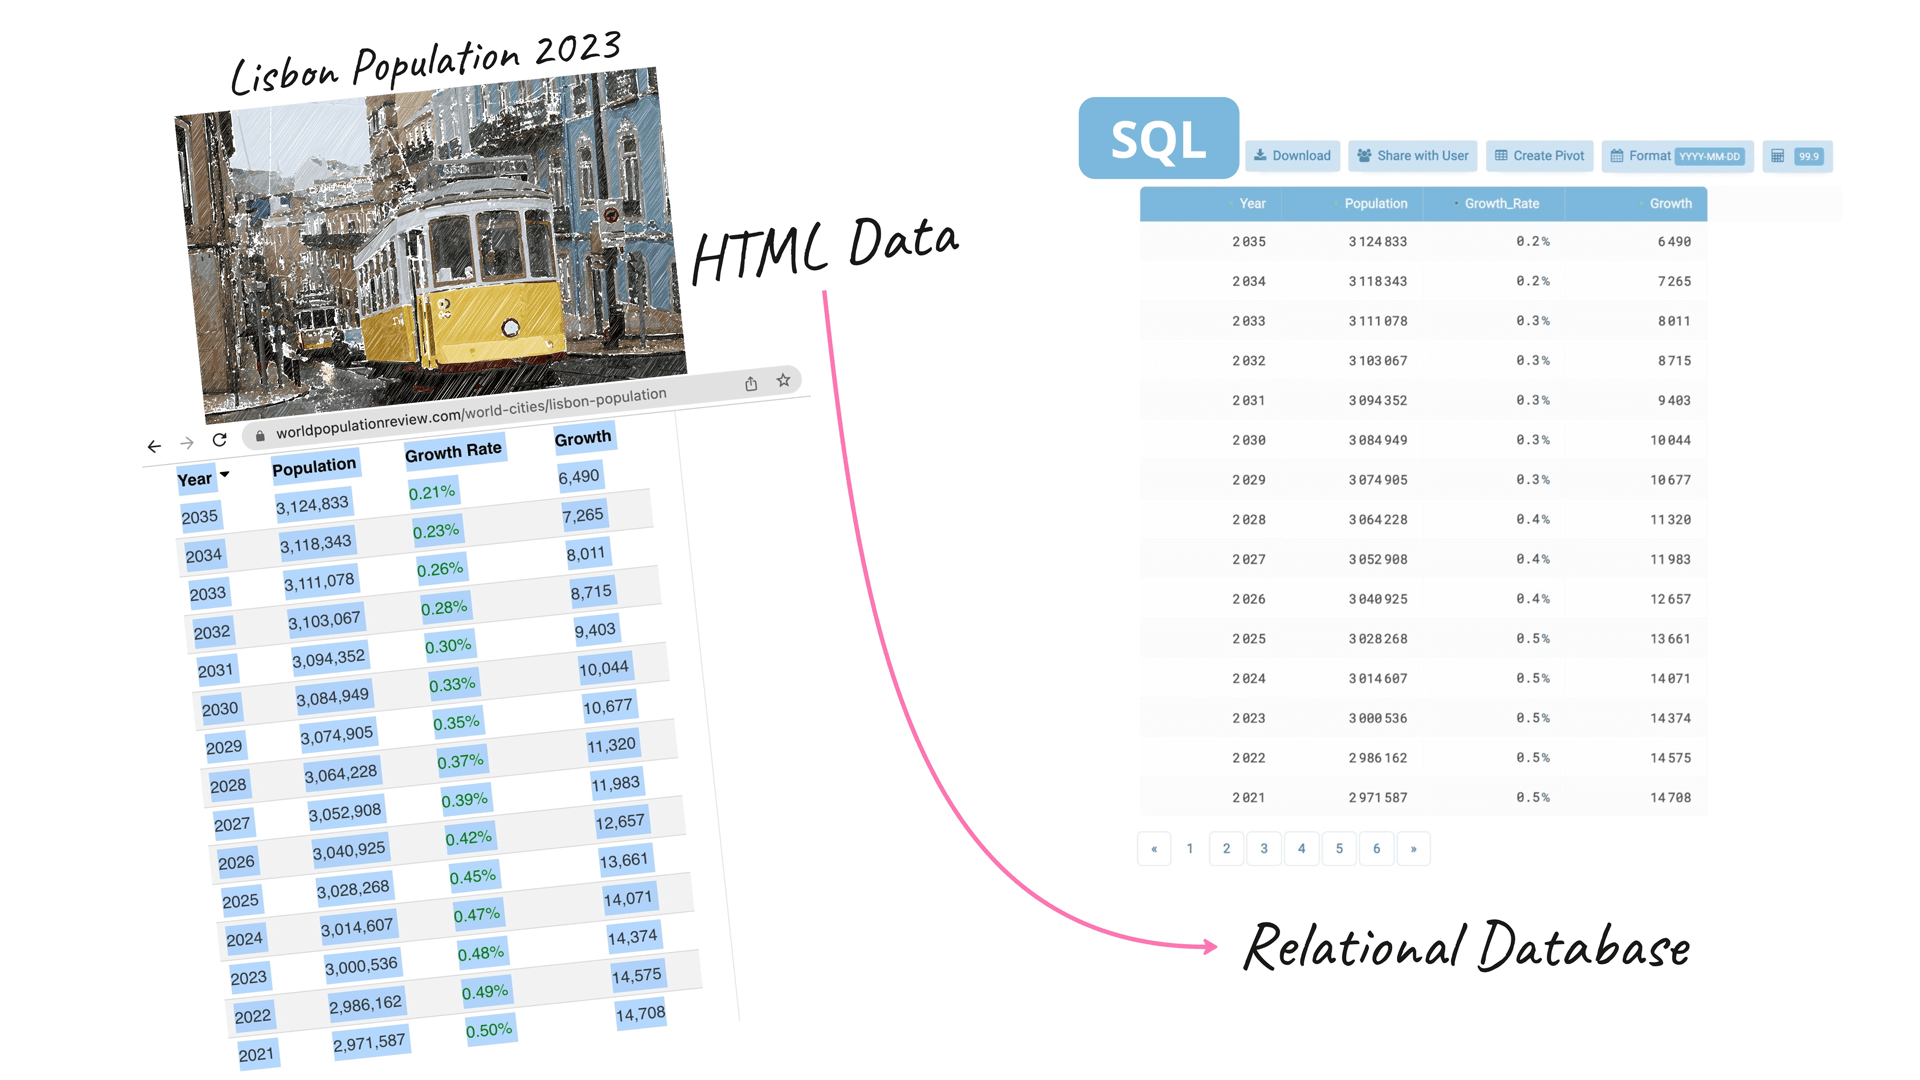
In this post, I’m going to show how you can quickly create a relational database from data represented as an HTML table via simple copy-and-paste.
Sometimes, you may need to work with the HTML data you find online. You come across a recently updated report you’re interested in and you want to dive into that data or transform and use it for ad-hoc reporting in your favorite BI/Data Visualization service. However, you can’t access the data on a web page via SQL. First, you need to parse, cleanse and import it into a relational database, which can be a tedious process.
When converting unstructured HTML tabular data into a relational database (SQL table), it is essential to ensure that:
1) SQL schema is generated;
2) all the values have been properly parsed, converted into corresponding values that match the data schema and later loaded into the database. This way, the numeric string becomes numbers and retains their arithmetic capabilities, date strings become actual SQL dates, etc.
TABLUM.IO helps to make this process fast and easy, turning any data into a ready-to-use database without coding. Let’s see how it works!
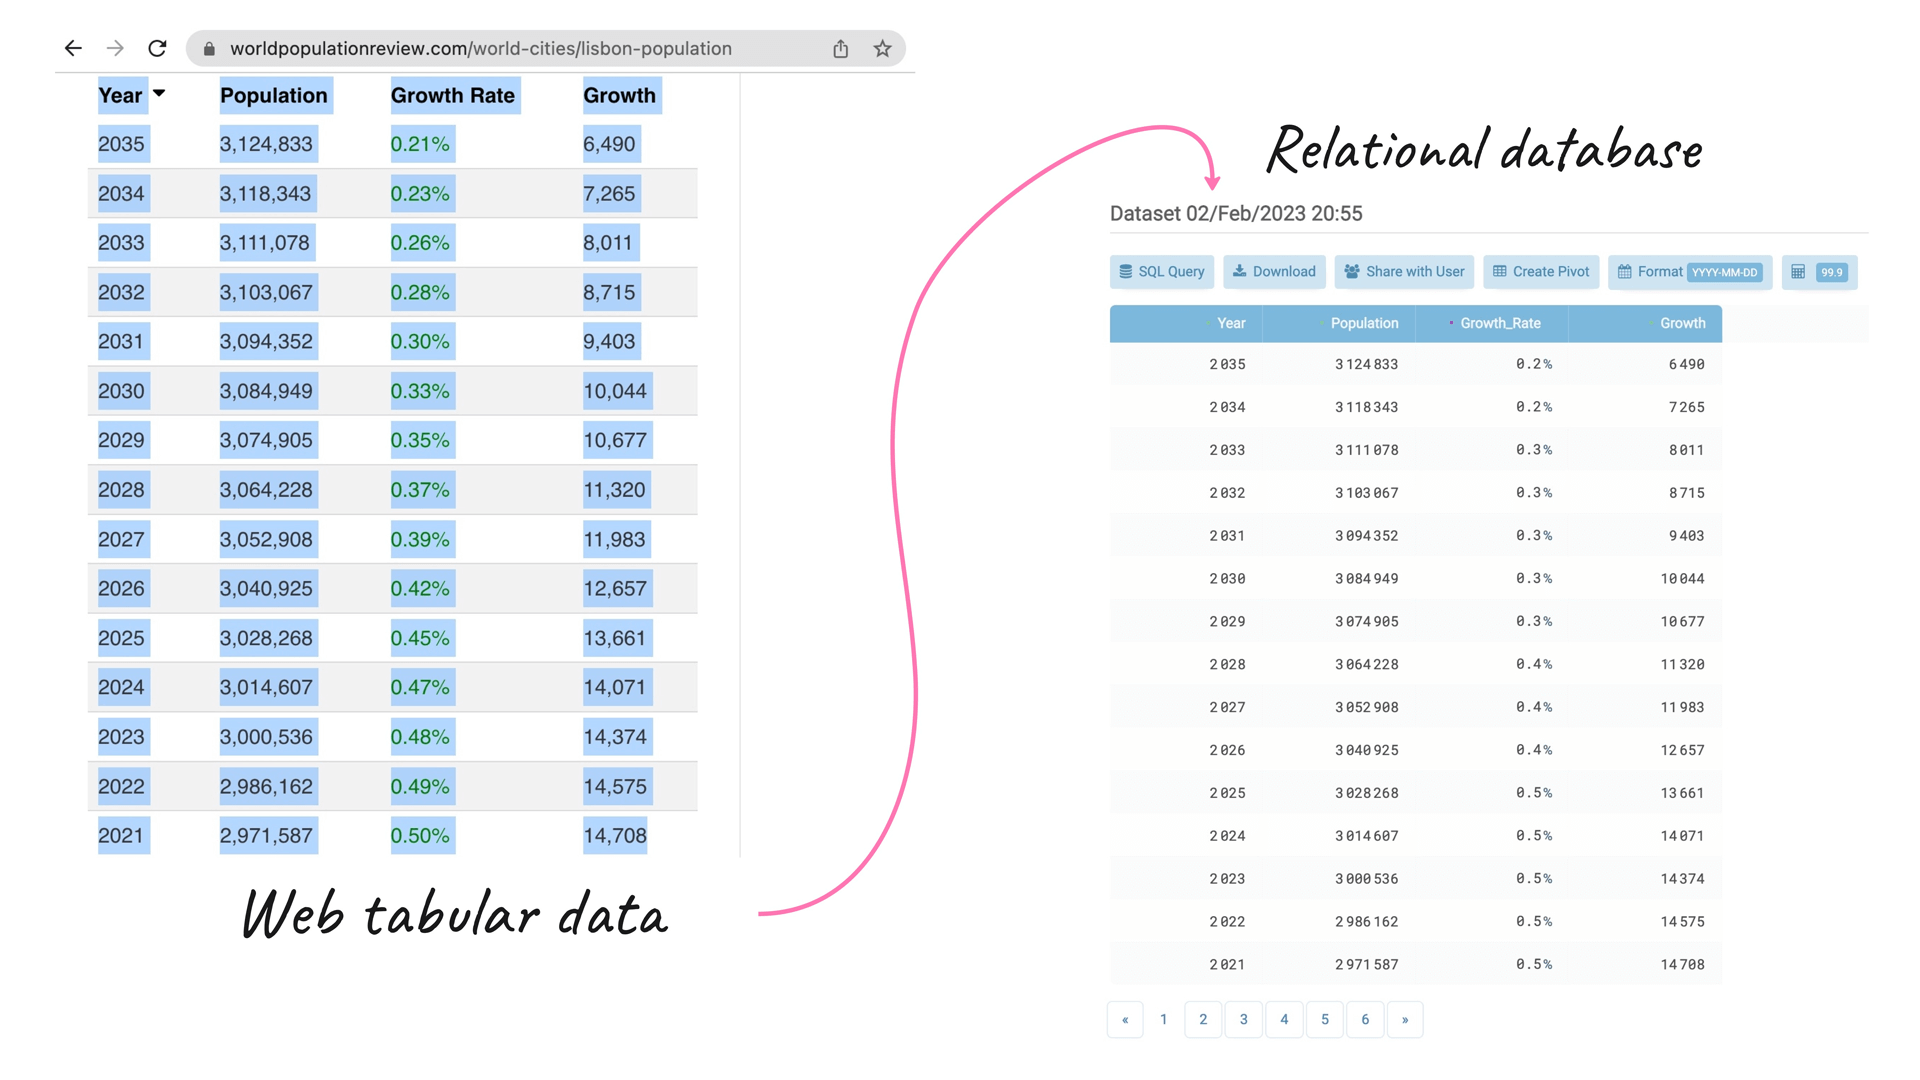
Data source. I’ll take a public dataset from the Web Population Review website to demonstrate the process of transforming raw HTML data into a SQL database.
The dataset provides an overview of Lisbon’s population estimates and projections. The information is represented as a common HTML table with several columns where the data is stored in different numeric formats (fragment):
When converting unstructured HTML tabular data into a relational database (SQL table), it is essential to ensure that:
1) SQL schema is generated;
2) all the values have been properly parsed, converted into corresponding values that match the data schema and later loaded into the database. This way, the numeric string becomes numbers and retains their arithmetic capabilities, date strings become actual SQL dates, etc.
TABLUM.IO helps to make this process fast and easy, turning any data into a ready-to-use database without coding. Let’s see how it works!
Data source. I’ll take a public dataset from the Web Population Review website to demonstrate the process of transforming raw HTML data into a SQL database.
The dataset provides an overview of Lisbon’s population estimates and projections. The information is represented as a common HTML table with several columns where the data is stored in different numeric formats (fragment):
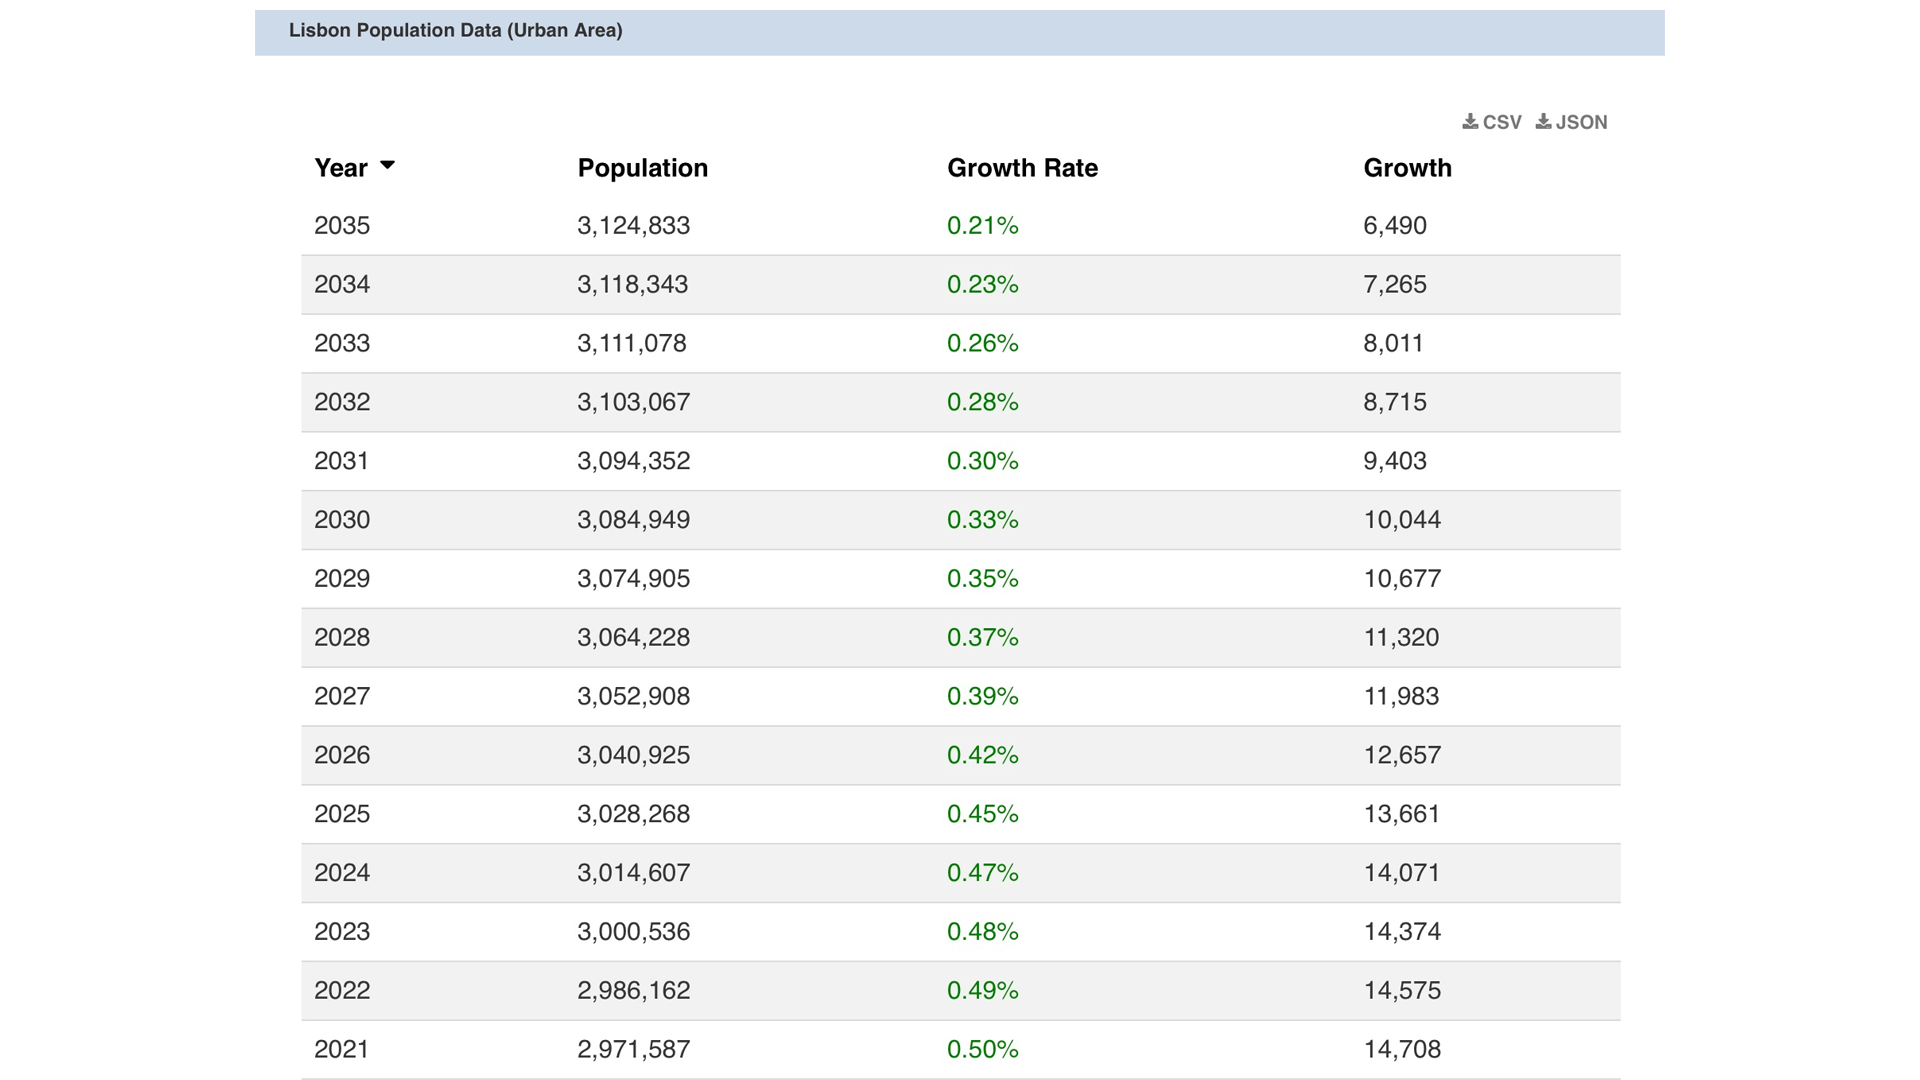
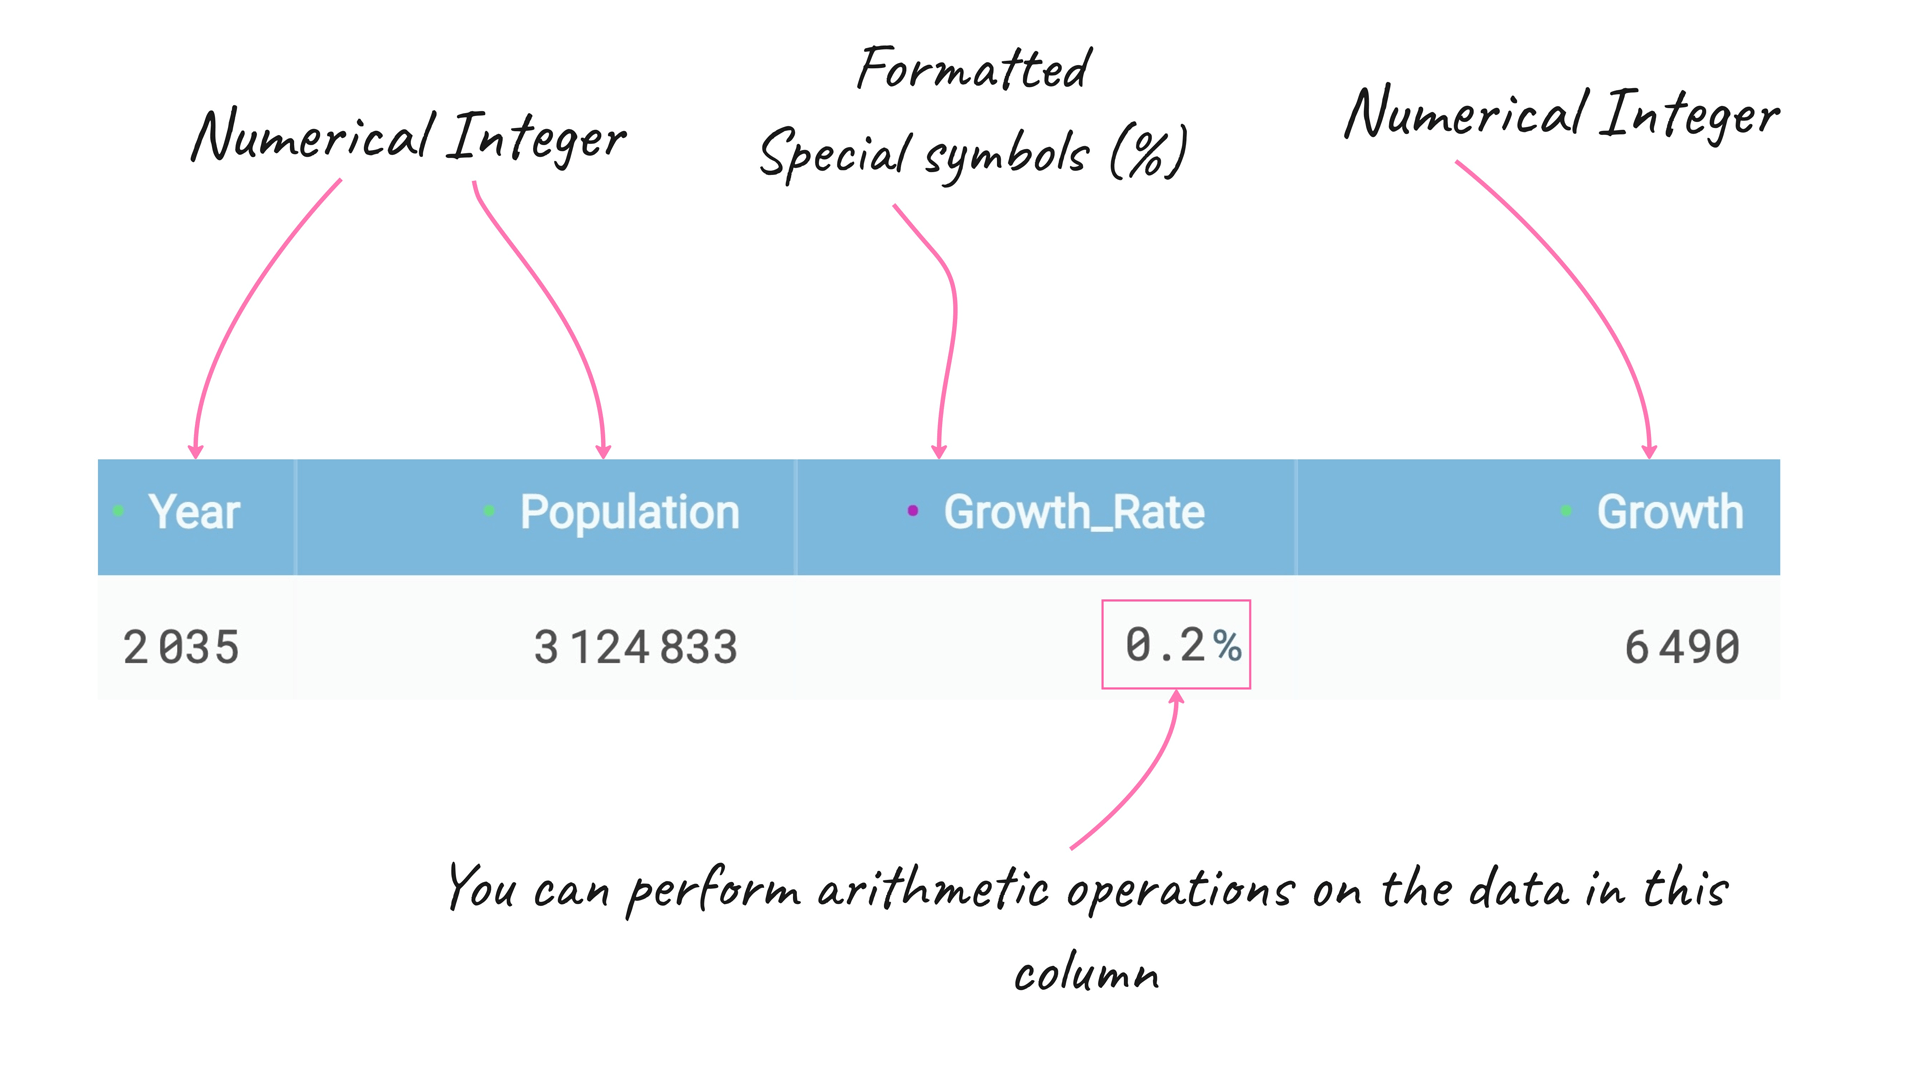
Before the actual data “copy-and-paste” from the HTML table to TABLUM.IO, let’s take a look at what is the table:
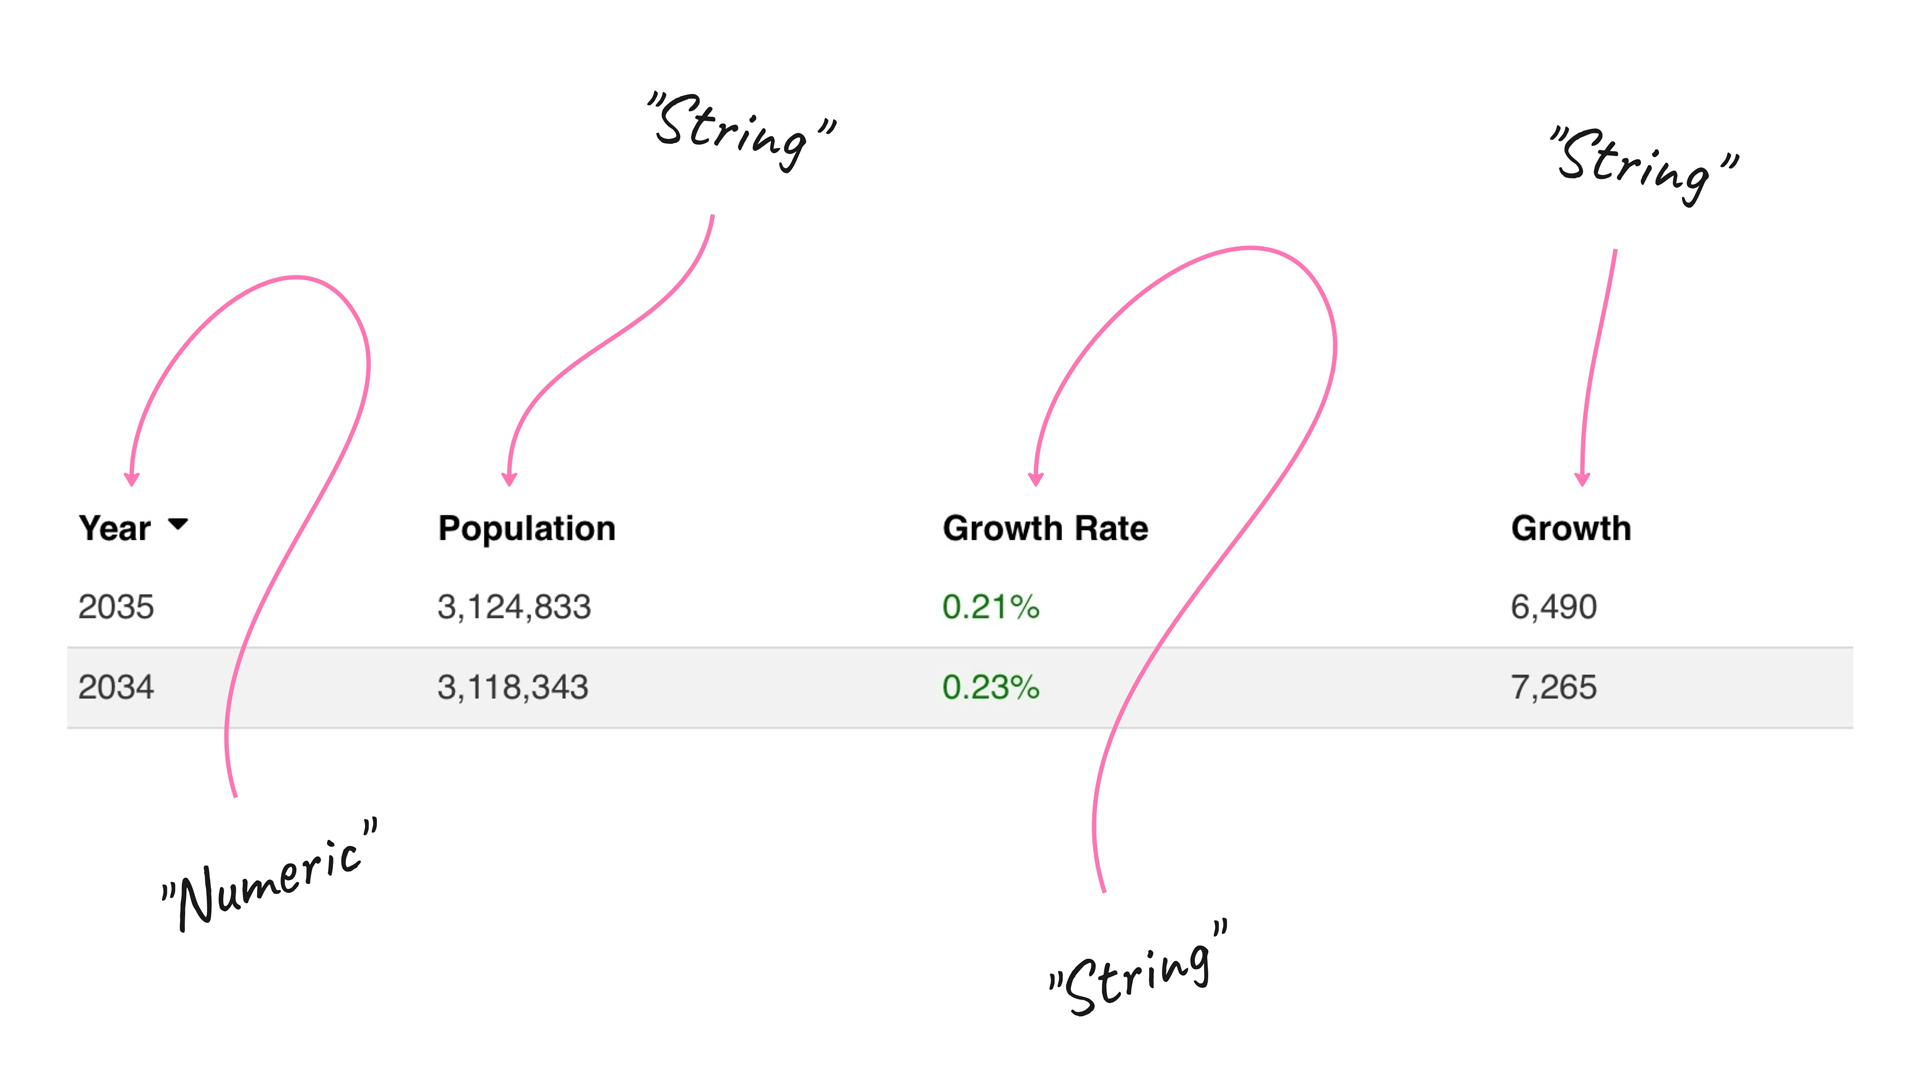
Column values:
- The first column is an integer value.
- The second column is a formatted integer with commas (comma-separated digits) which is a string from the SQL database perspective.
- The third column is a percentage (floating-point percentage value) which is a string from the SQL database perspective as well.
- The fourth column is an integer with comma separation for digits, again, a string that represents an integer value.
In order to import these values into a relational database (SQL table) we have to parse and cleanse values turning strings into a corresponding integer or float values. TABLUM does it automatically, keeping the formatting we need. It also builds a SQL schema automatically upon data importing.
Turning HTML Data into a SQL Database
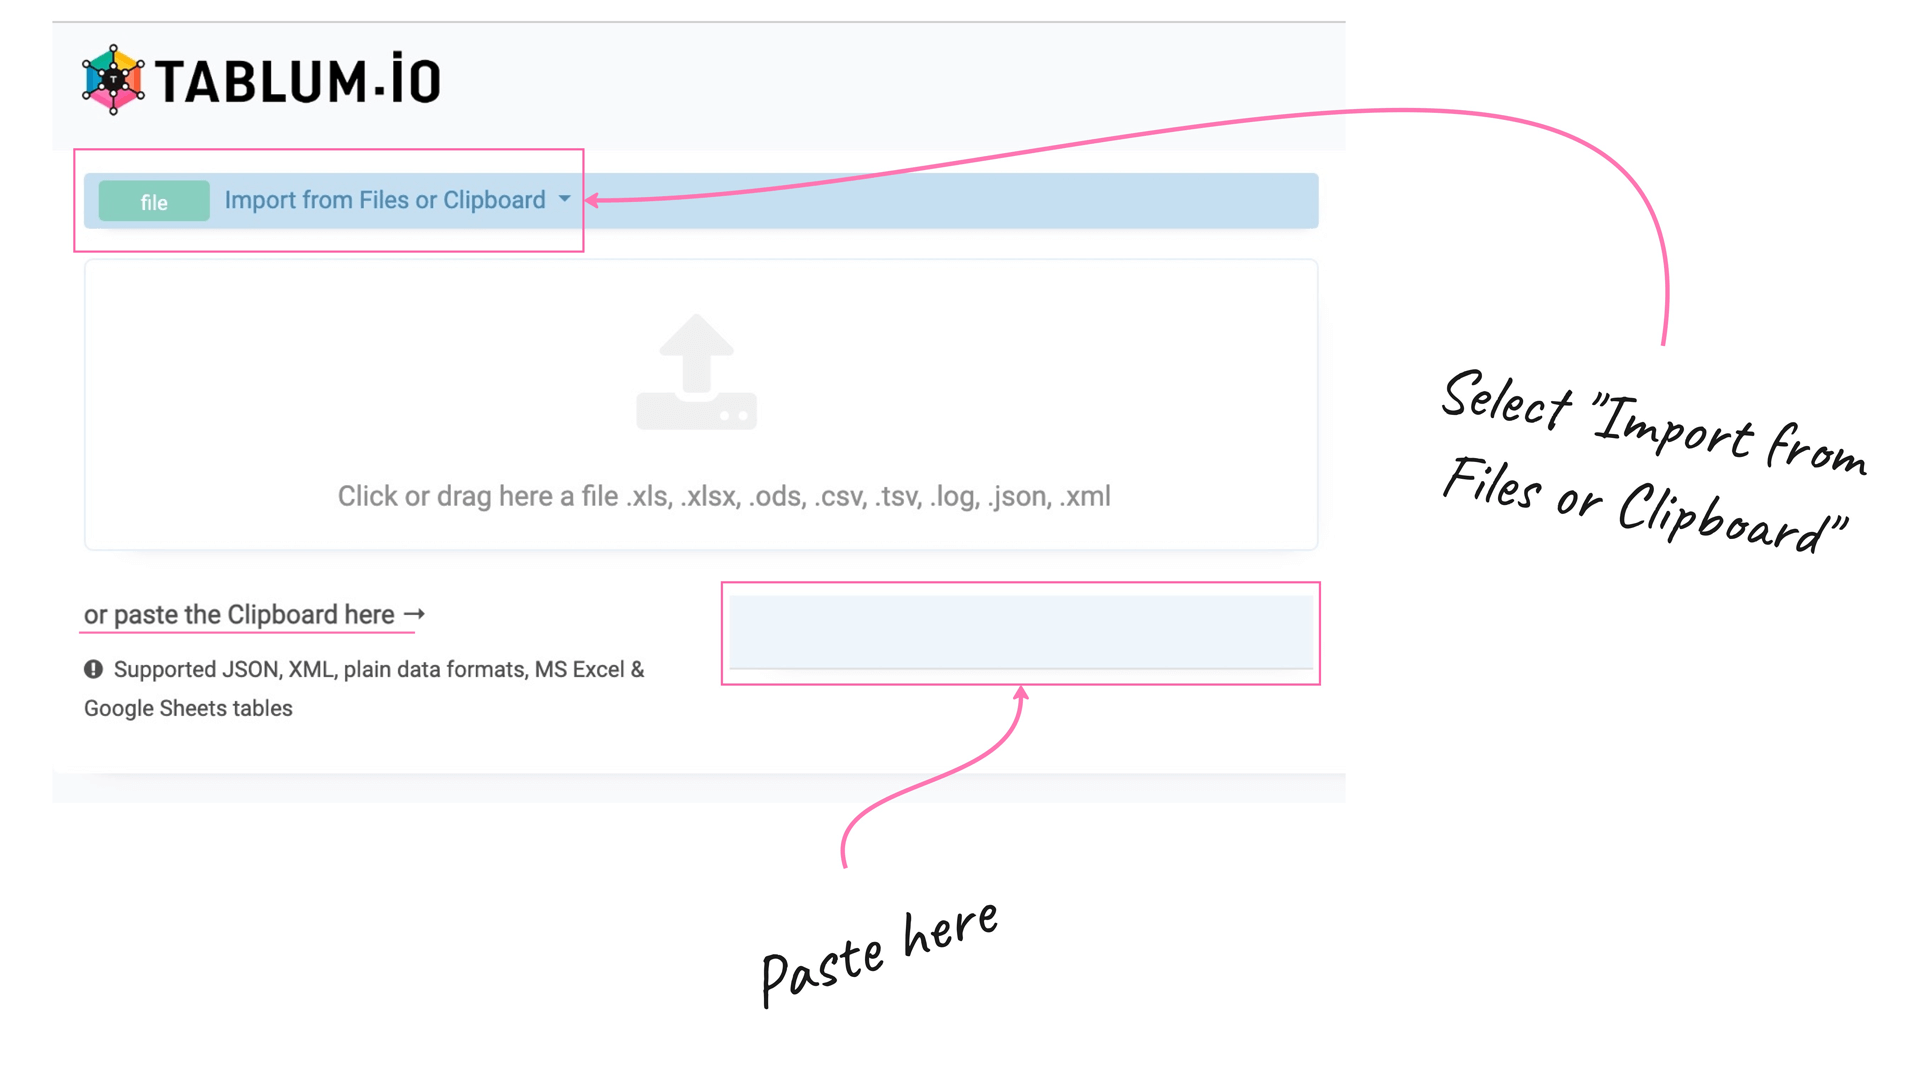
Now let’s go back to the World Population Review website and copy the “Lisbon Population 2023” table from the web page to the clipboard.
Open TABLUM.IO and paste the data copied to the clipboard into the field shown below. Make sure you have selected the “Import from Files or Clipboard” option from the drop-down menu:
Open TABLUM.IO and paste the data copied to the clipboard into the field shown below. Make sure you have selected the “Import from Files or Clipboard” option from the drop-down menu:
Done. Having been loaded into TABLUM.IO the unstructured data from a webpage has become a relational database. Now it is ready for ad-hoc reporting:
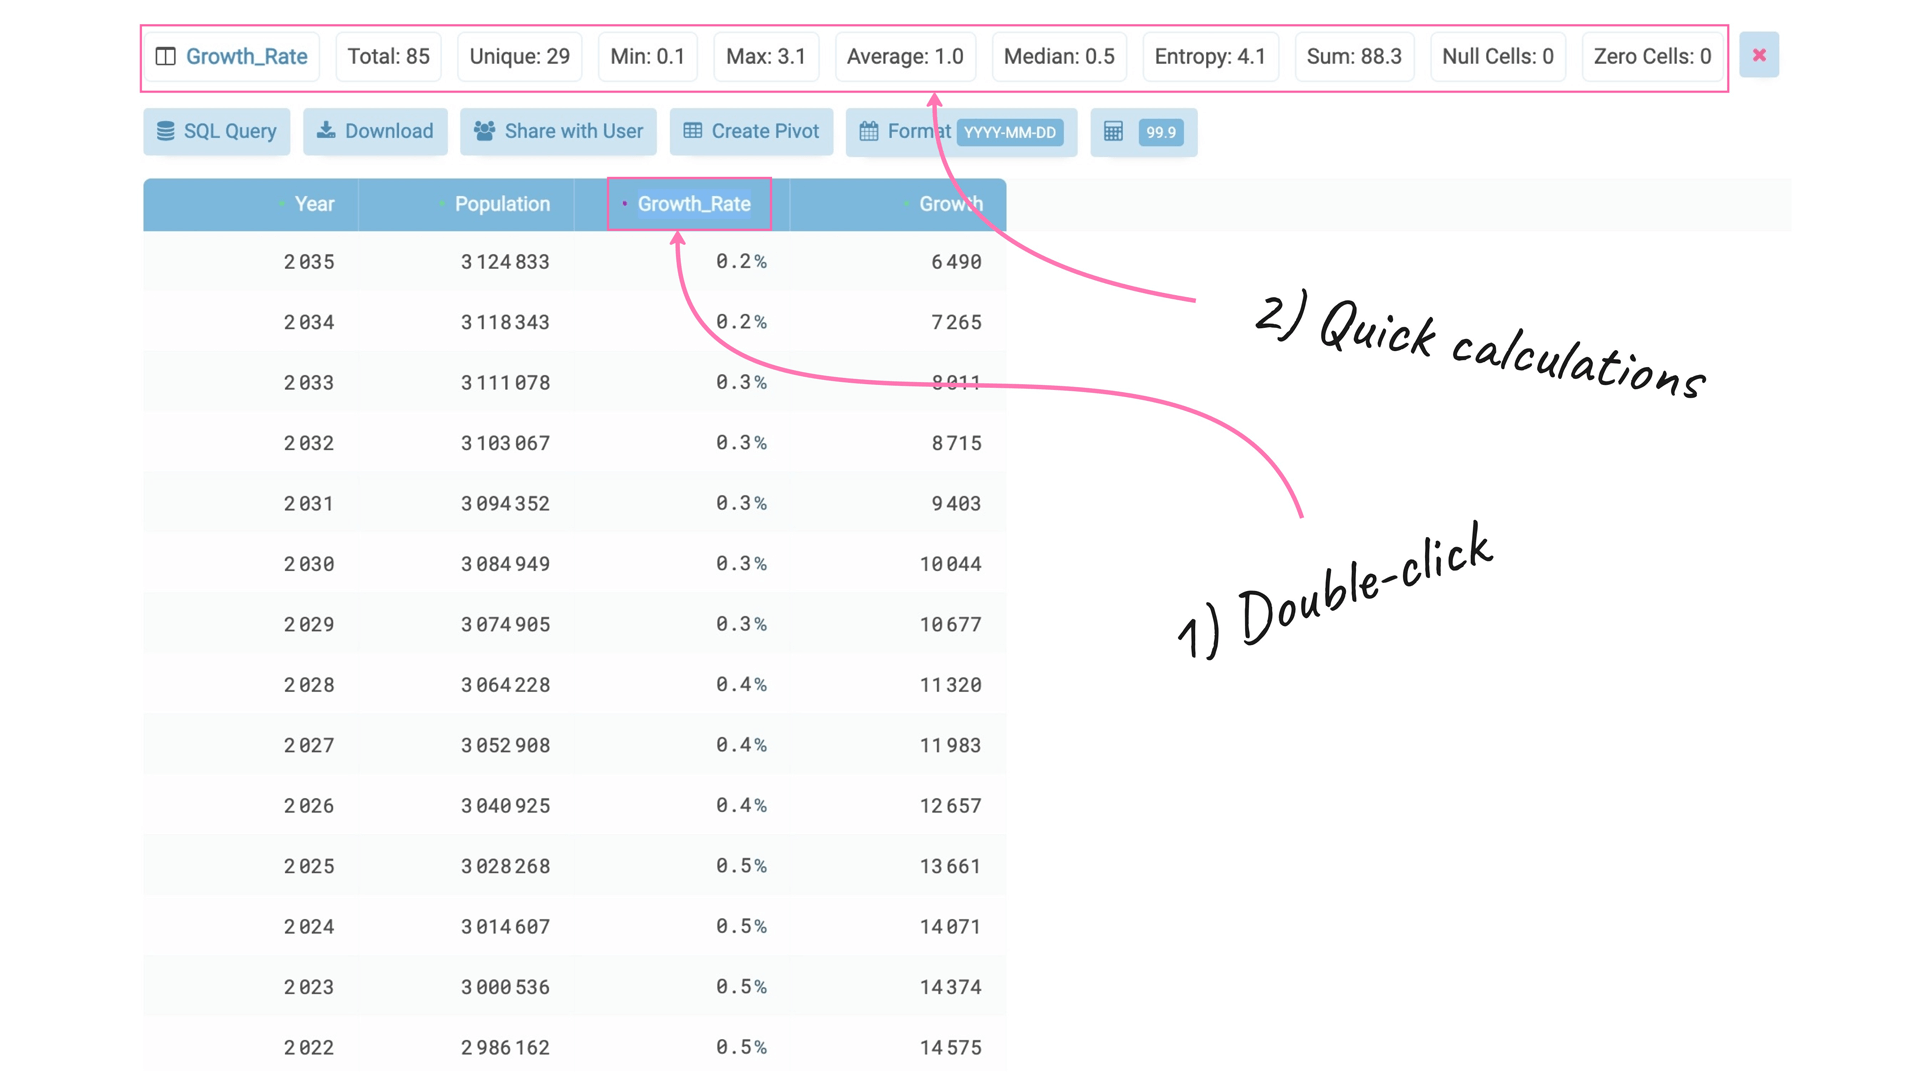
The SQL table now comprises four columns with different datatypes. The first, second, and fourth columns are the numerical data type. The third column is a specially formatted column that has been formatted as percentages. TABLUM.IO not only recognizes the column as a percentage but also provides the ability to query/process the values as a number (integer or float). Very few data tools support this automatic data recognition, SQL schema generation, and data normalization. With its advanced capabilities, TABLUM.IO makes it easier for data analysts to get down to analysis faster skipping tedious data preparation routine:
If you double-click on the “Growth Rate” column header, you’ll be shown the average, minimum, maximum, etc of the values in this column:
Let’s experiment with this data and run our first SQL query.
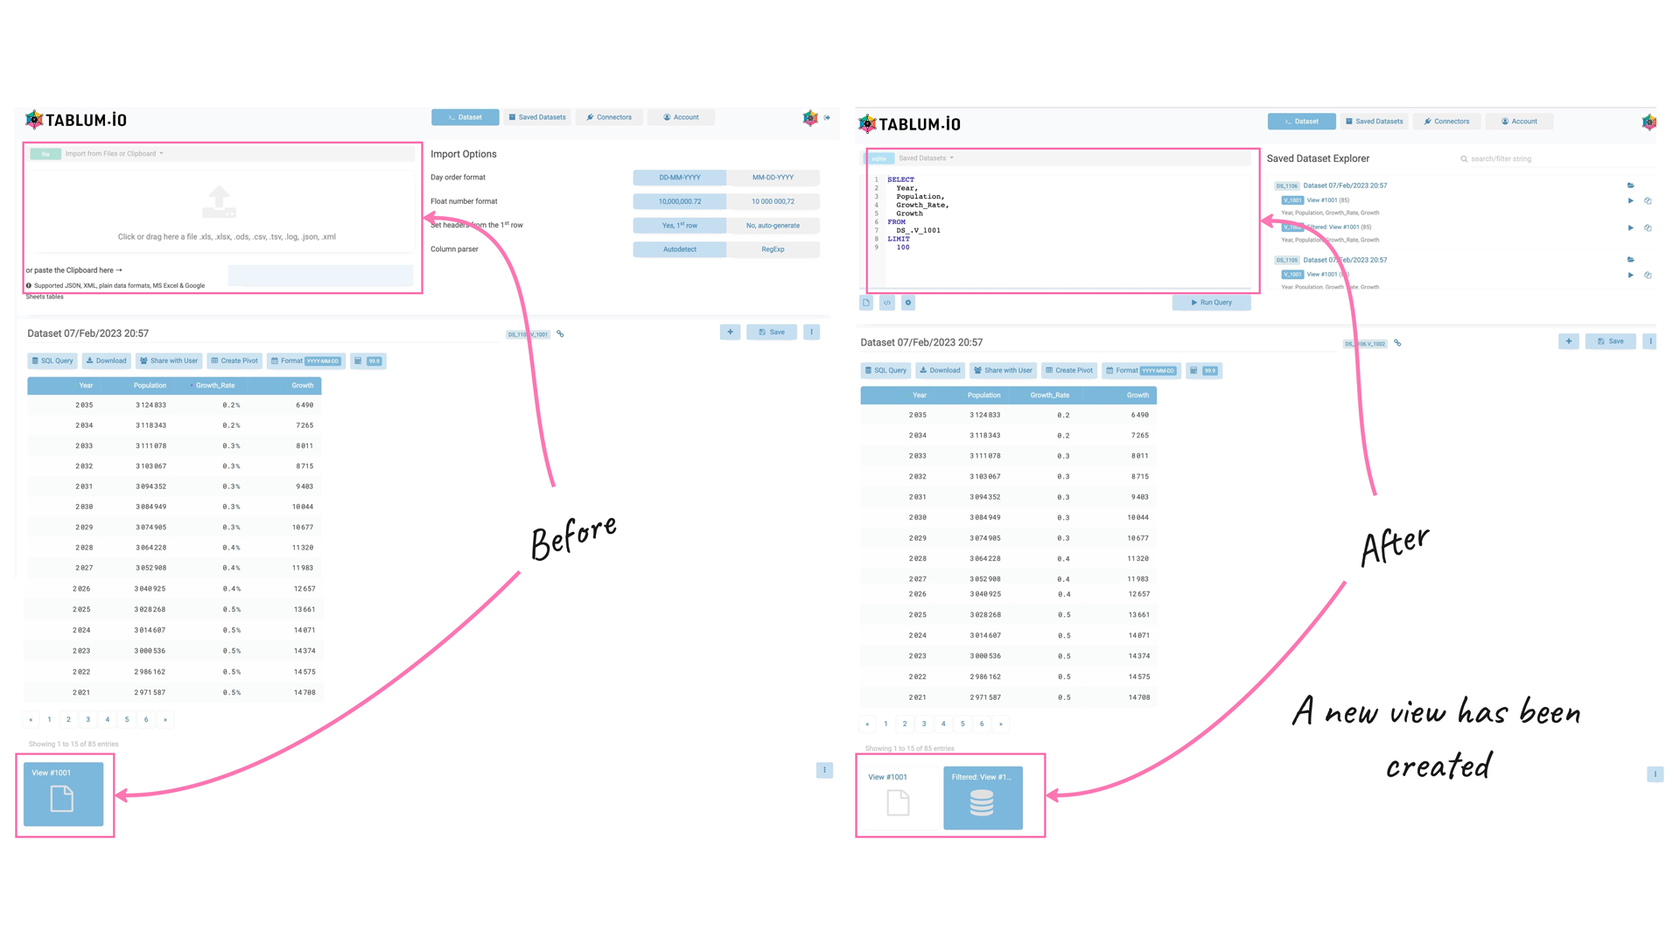
To start querying a database in TABLUM.IO, you need to click on the “SQL Query” button:
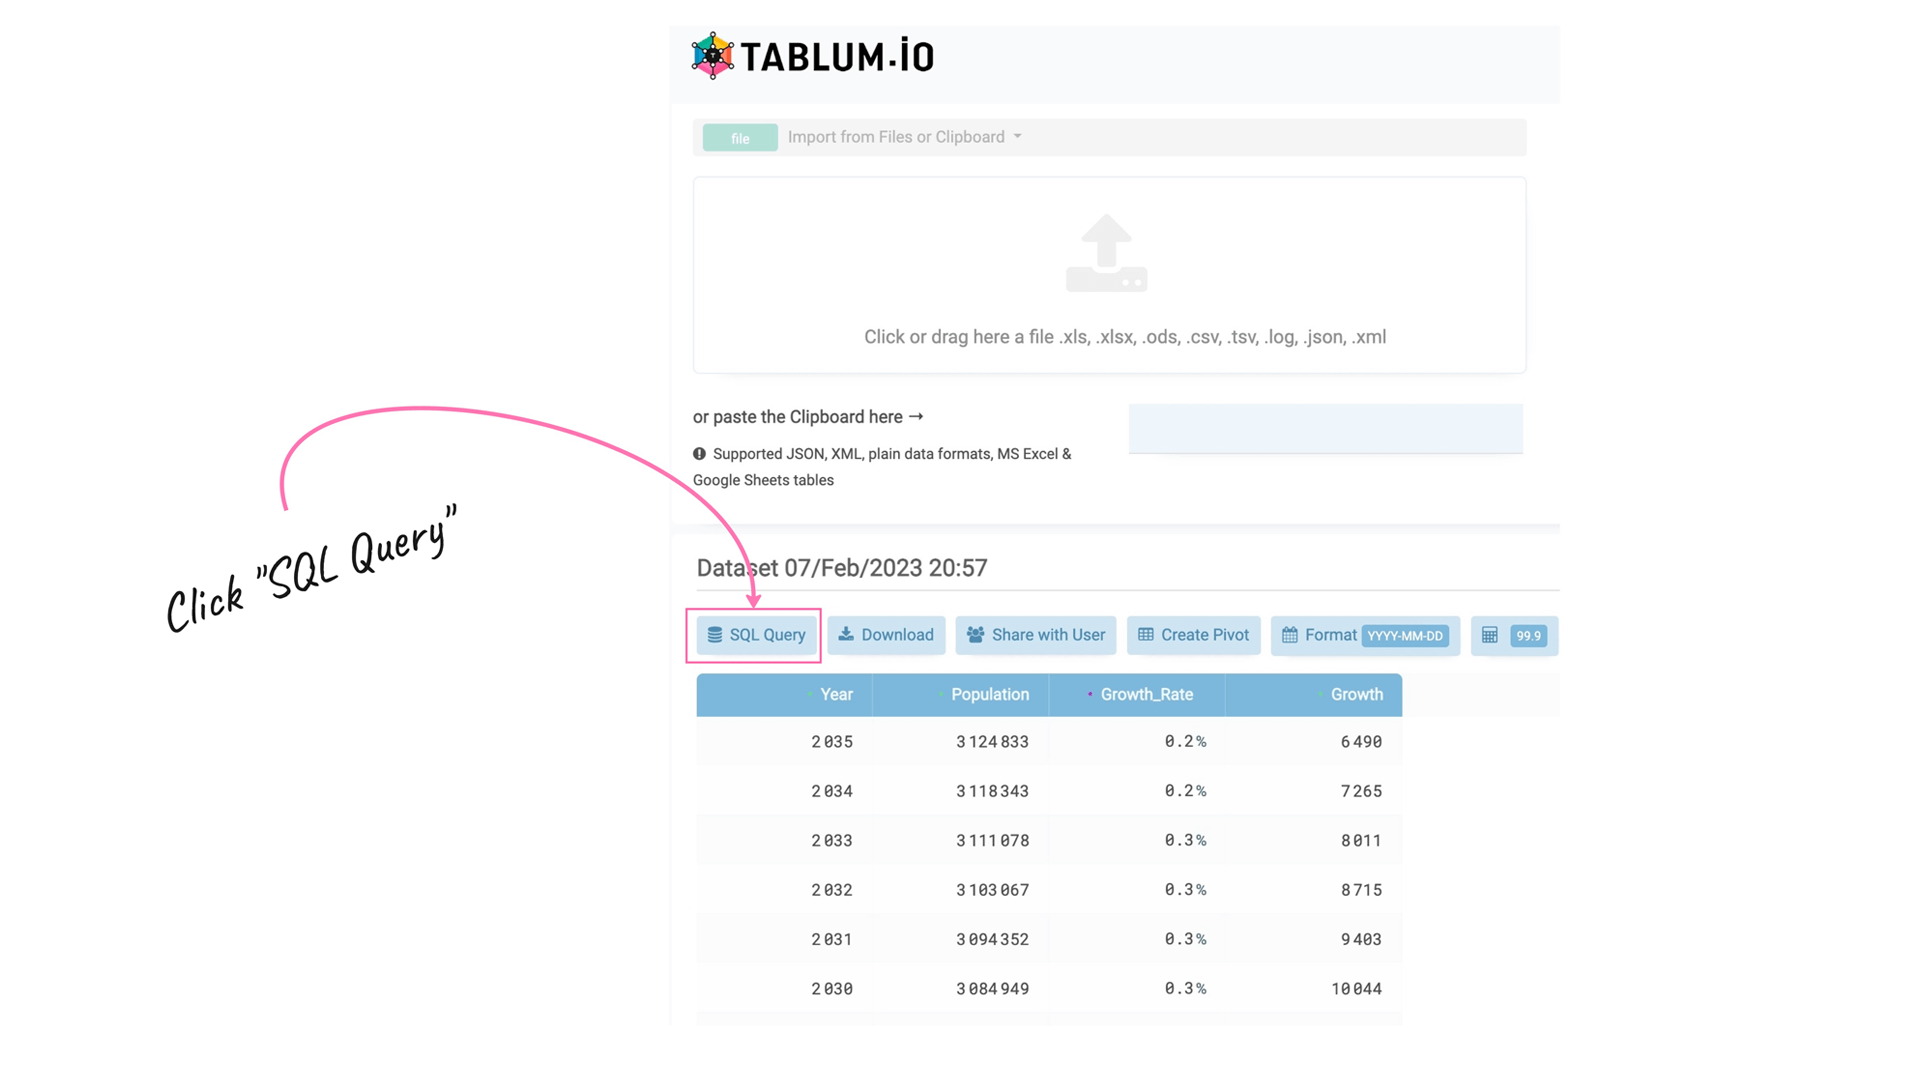
In response, the system creates a new TABLUM View with the SQL Console filled with the default “SELECT” query for the entire SQL table. So, basically, we start querying from the data source which is our recently loaded data from the clipboard:
I’m analyzing the Lisbon population data and would like to identify the years when the growth rate was more than 0.5%.
Let’s write the following SQL query in the TABLUM.IO SQL Console to meet my requirement and then click on the “Run Query” button:
SELECT
  Year,
  Population,
  Growth_Rate,
  Growth
FROM
  DS_.V_1001
  WHERE Growth_Rate > 0.5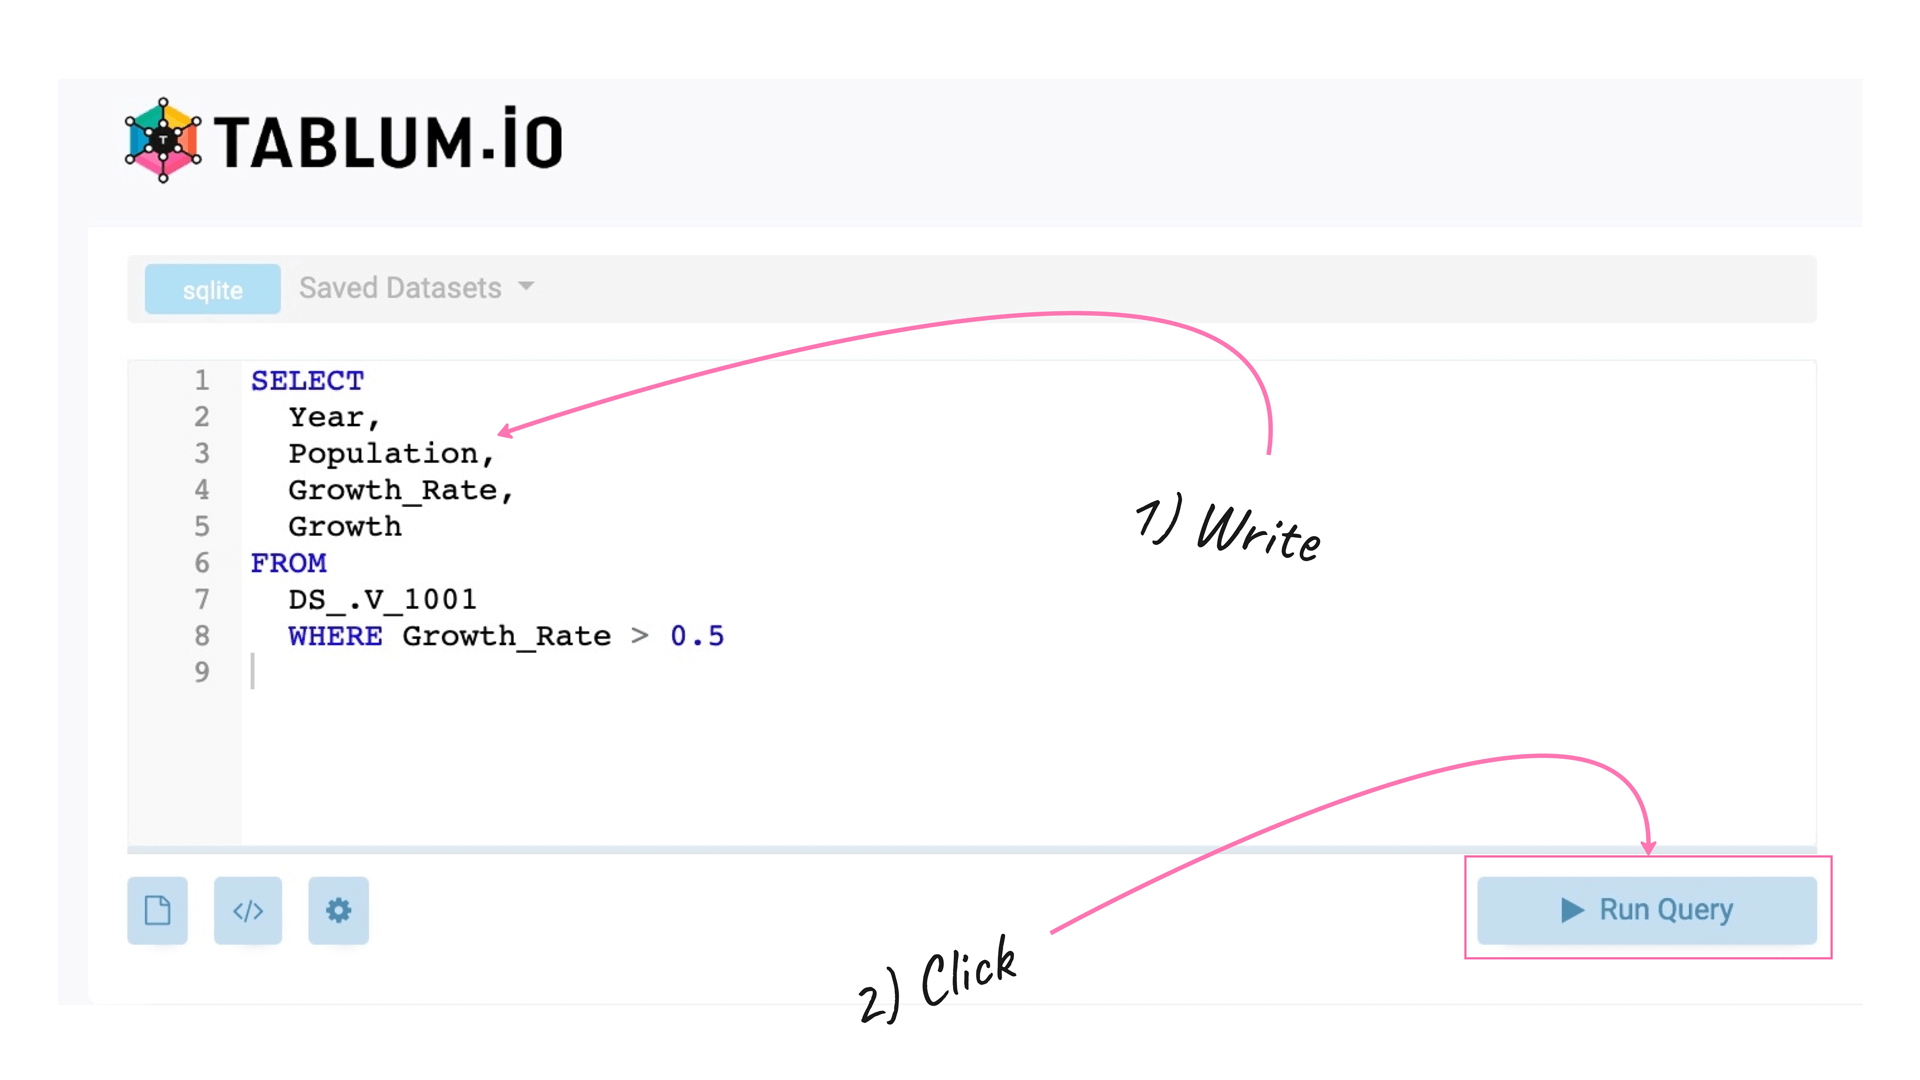
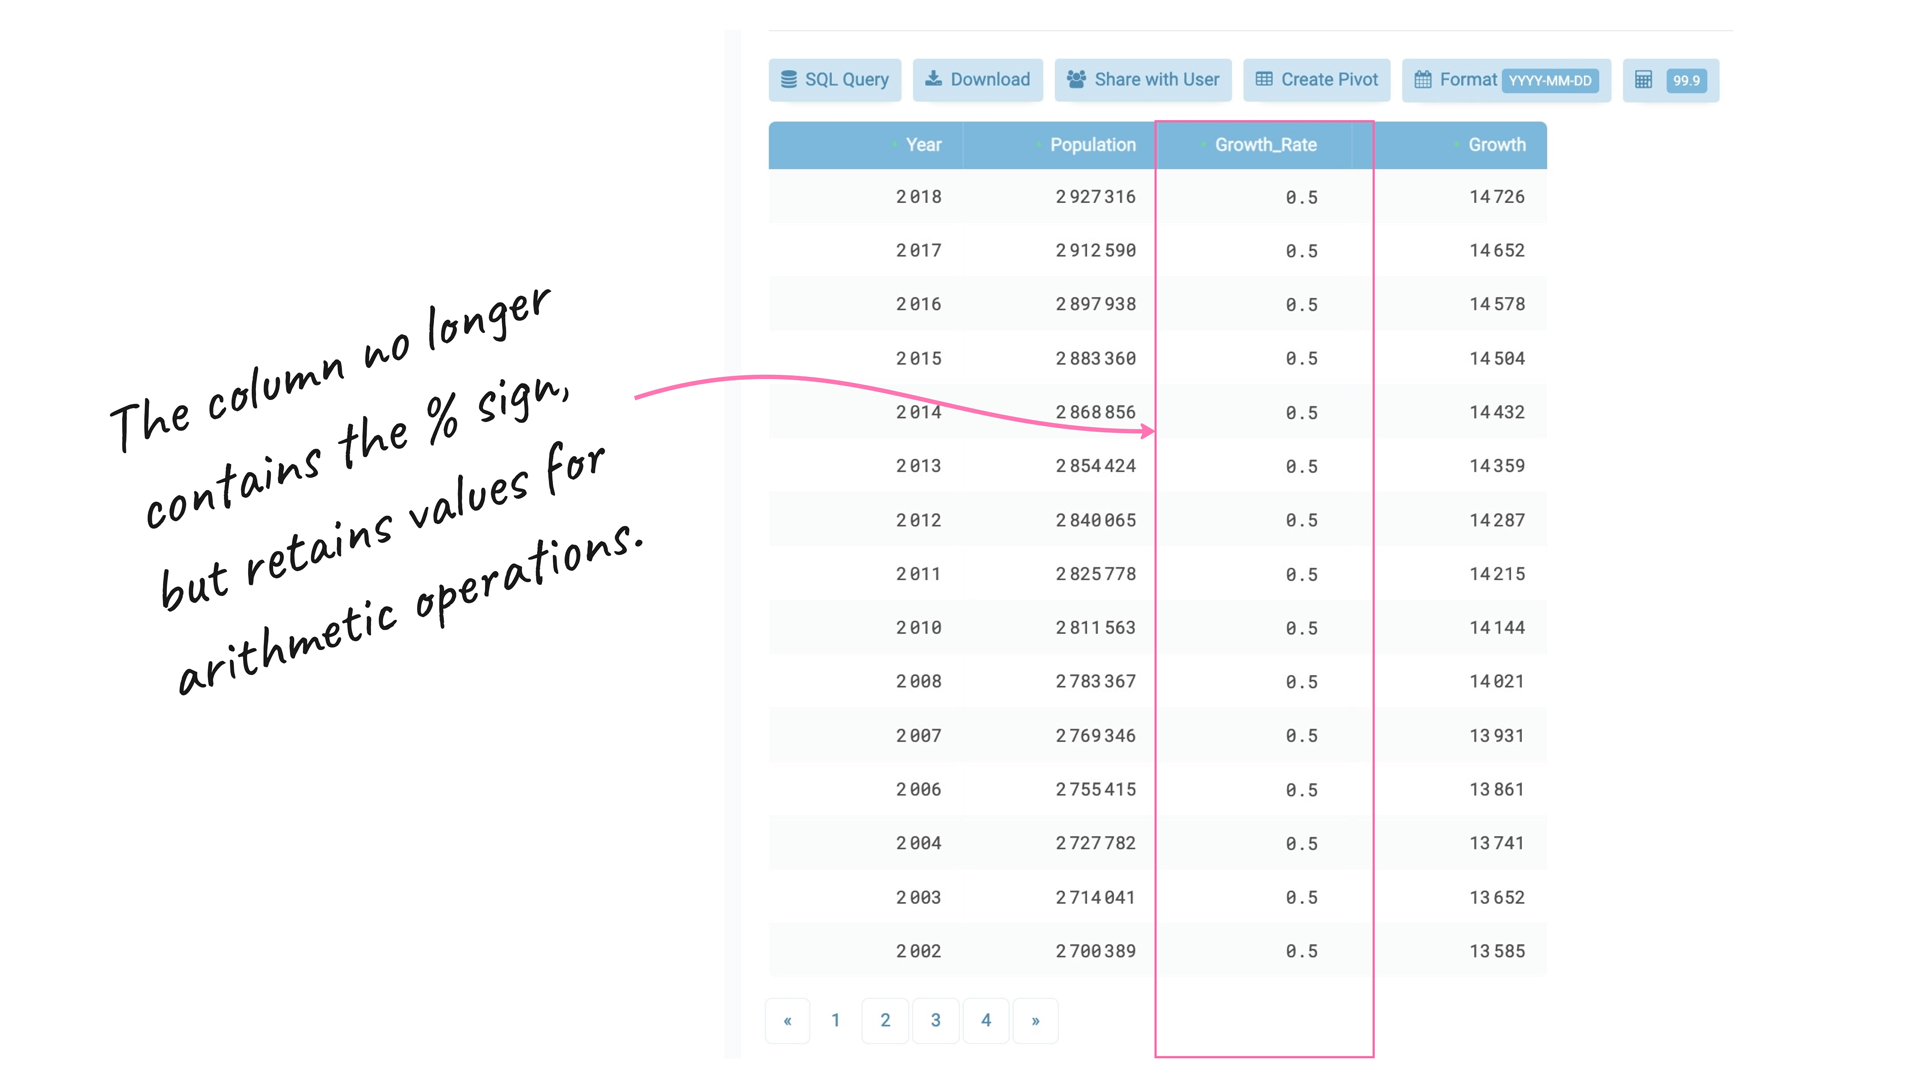
Done! Now we can see all the years where Growth Rate was higher than 0.5%. The column no longer has a % sign (meta-data), but the values are still numbers (float type). You can continue to run arithmetical operations on the column:
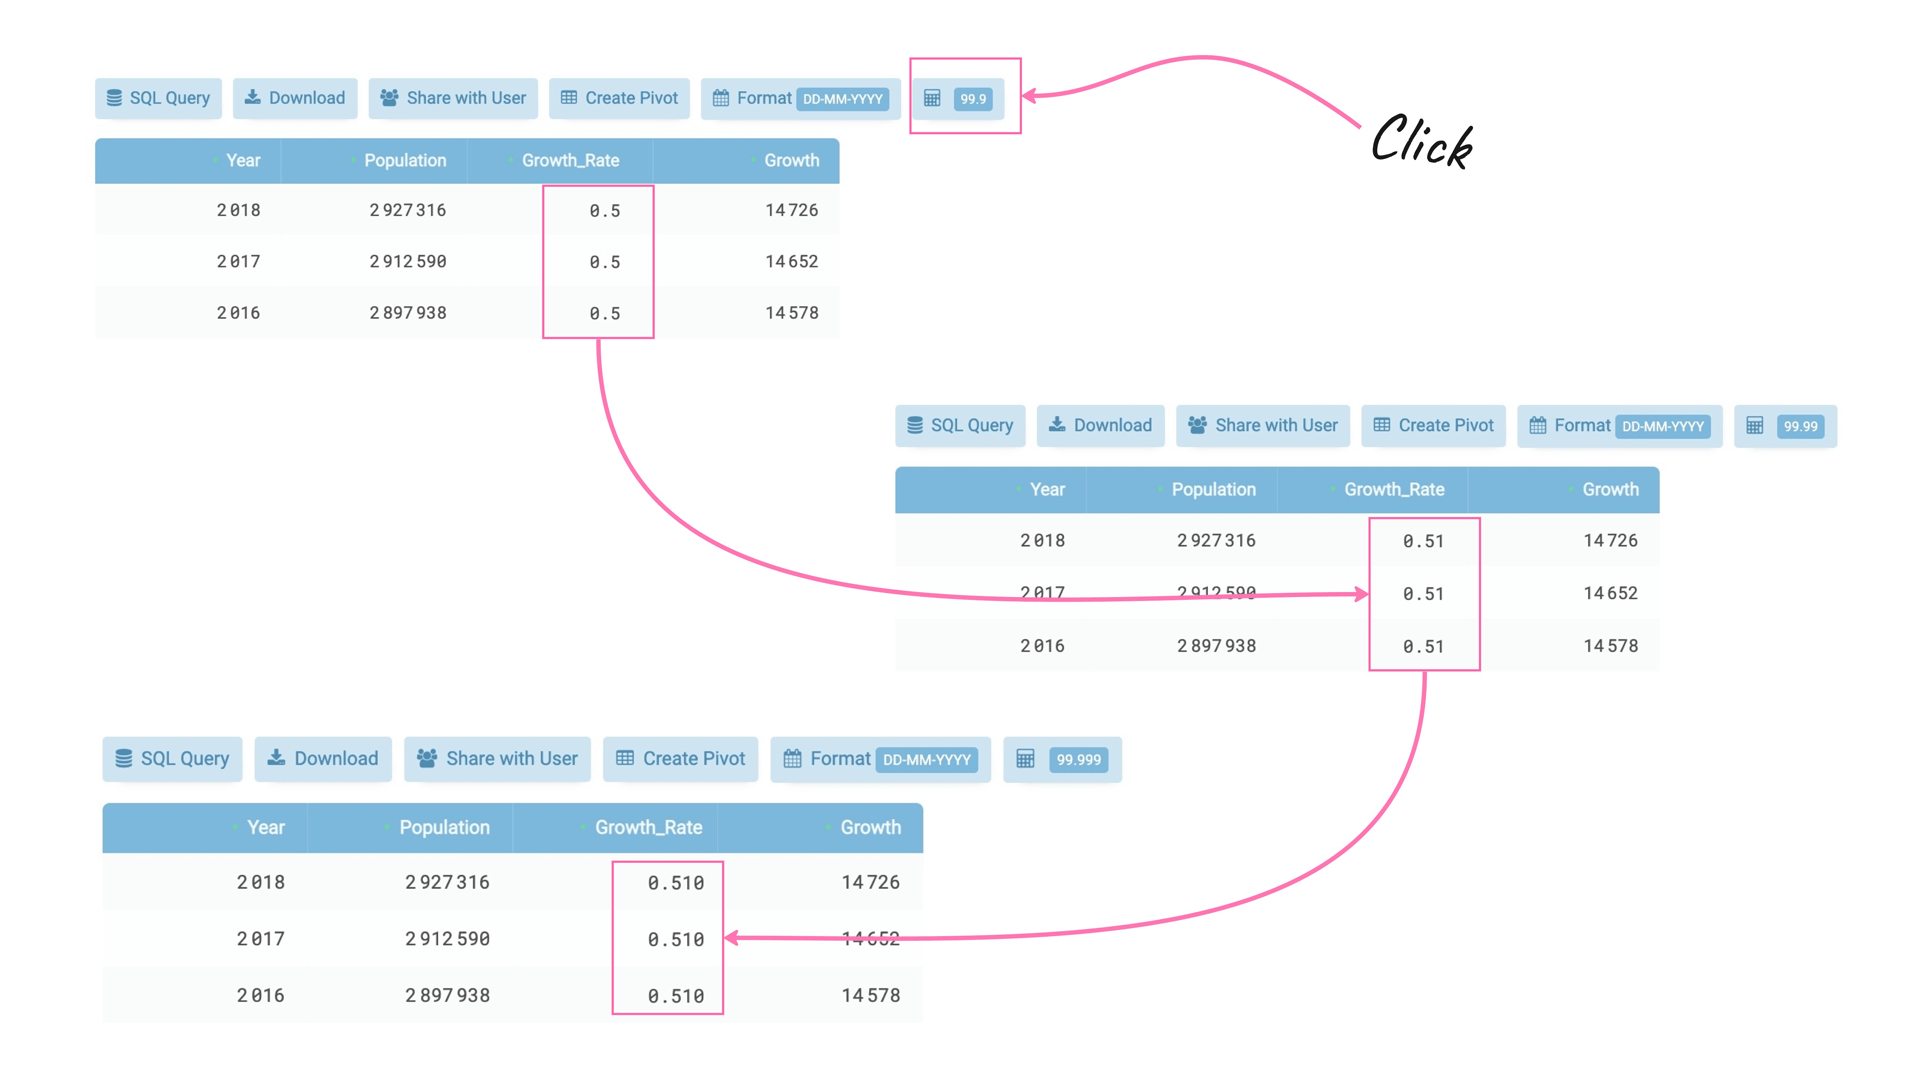
To view the float numbers with higher precision, click on the “Calculator” button:
Now I want to find the top 10 years when the population of Lisbon reached its highest rate of growth. The following query will help me to answer my question:
SELECT
  Year,
  Population,
  Growth_Rate,
  Growth
FROM
  DS_.V_1001
ORDER BY Growth_Rate desc
LIMIT 10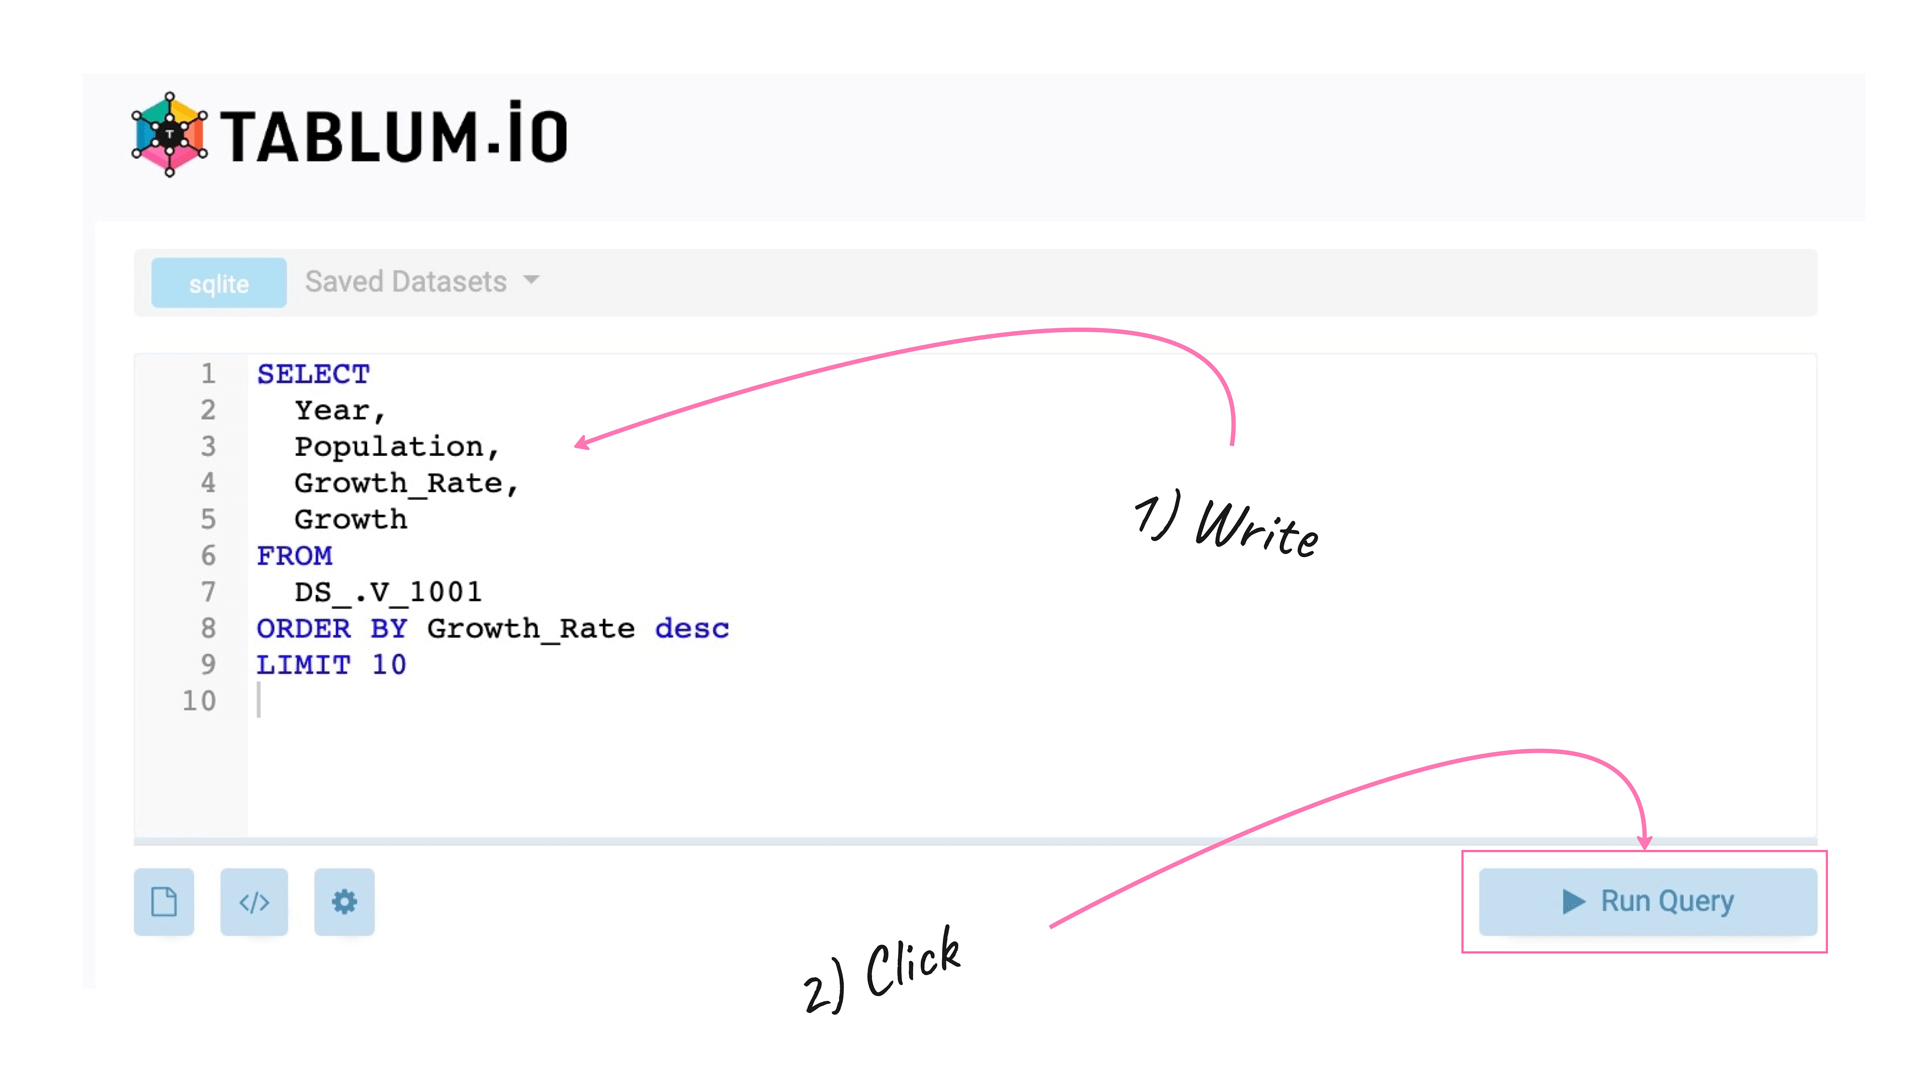
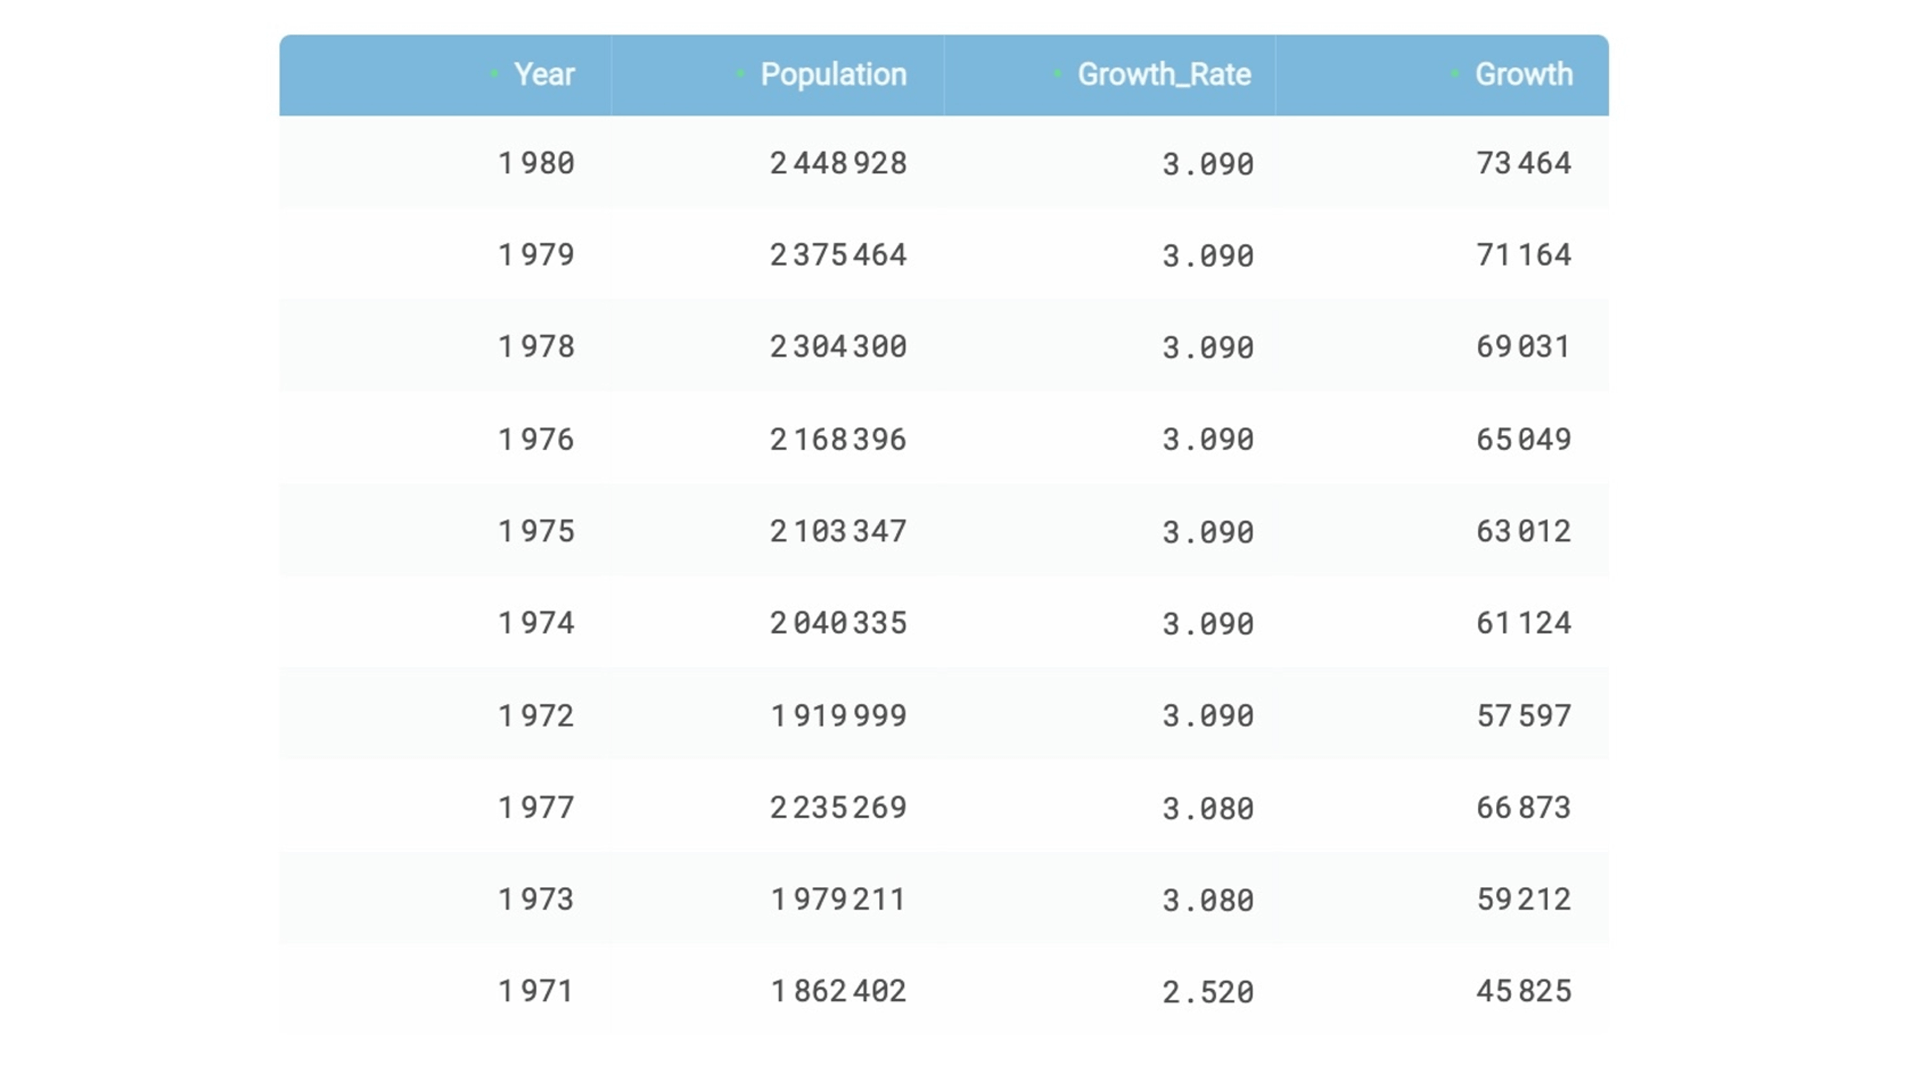
As a result, we have a SQL table with the top 10 years when the population of Lisbon, Portugal’s capital, reached its peak:
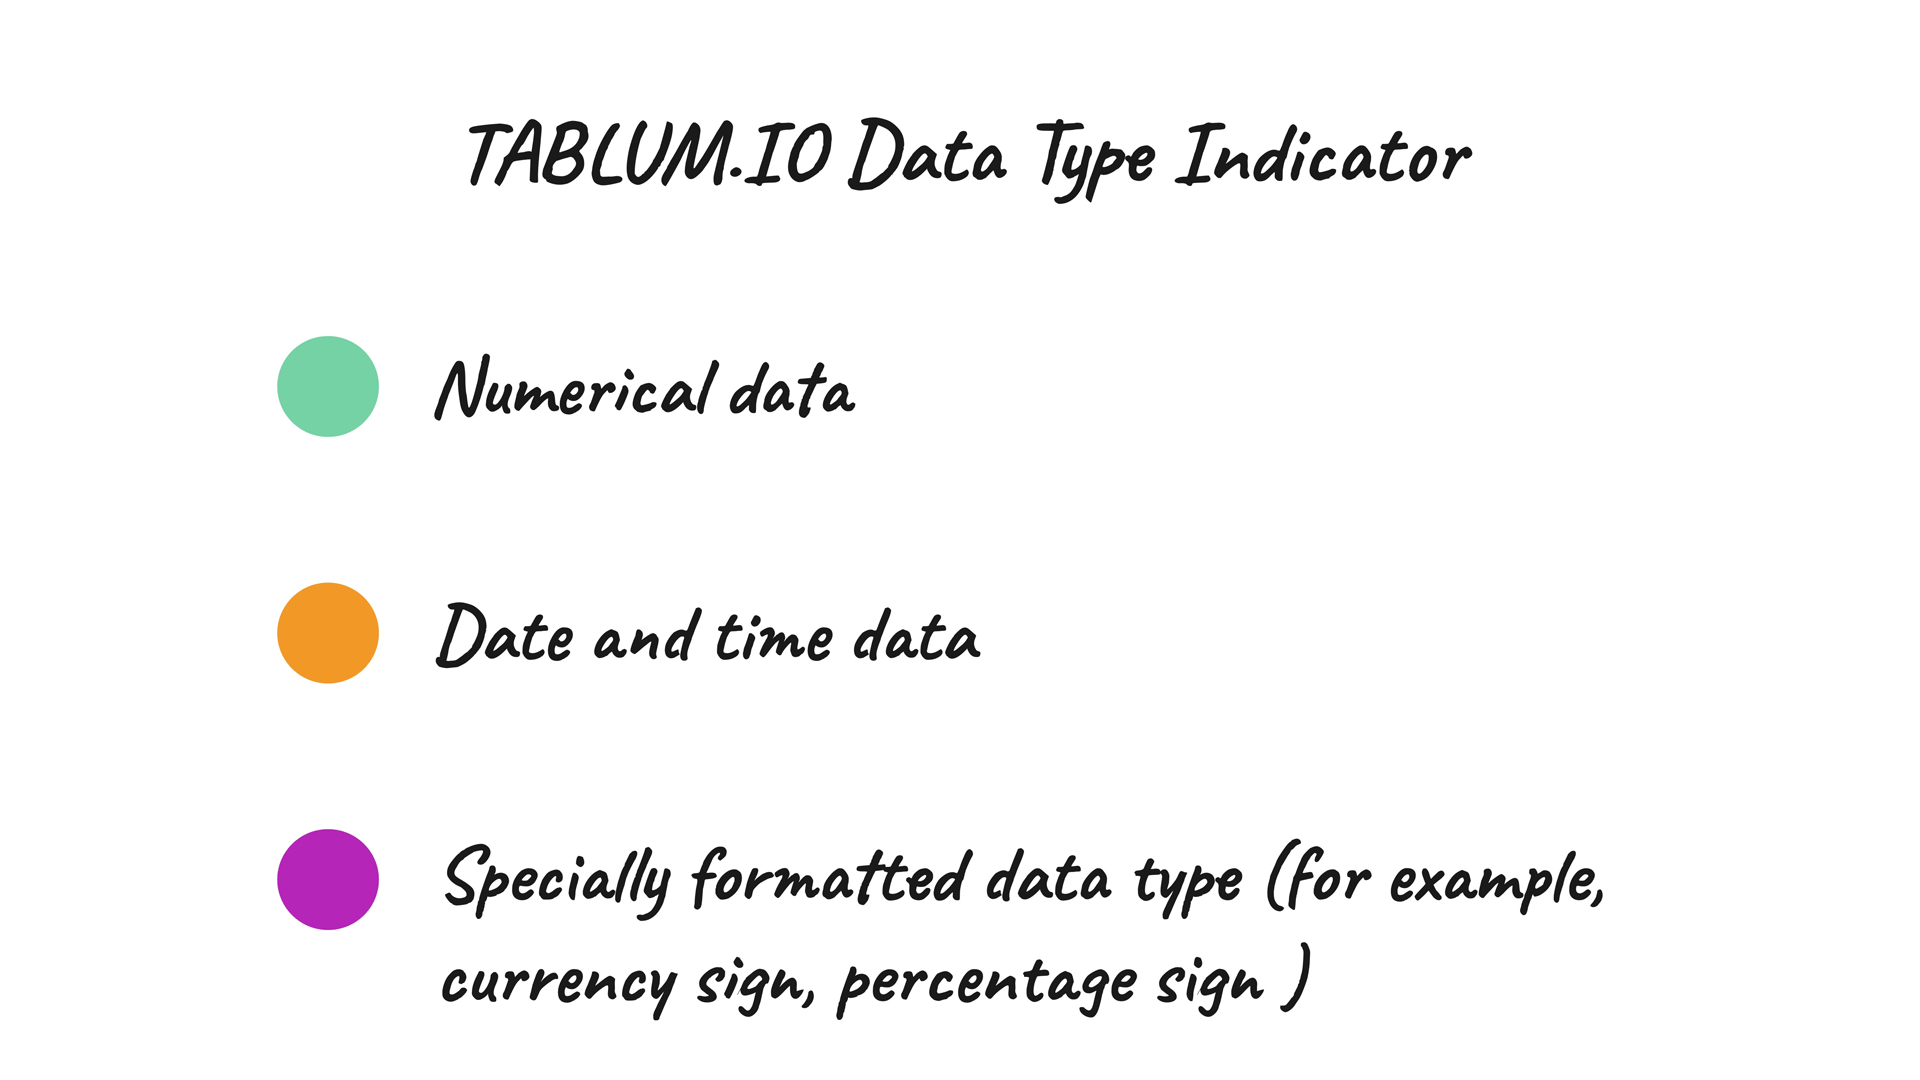
TABLUM.IO Color-Coded Data Type Identification
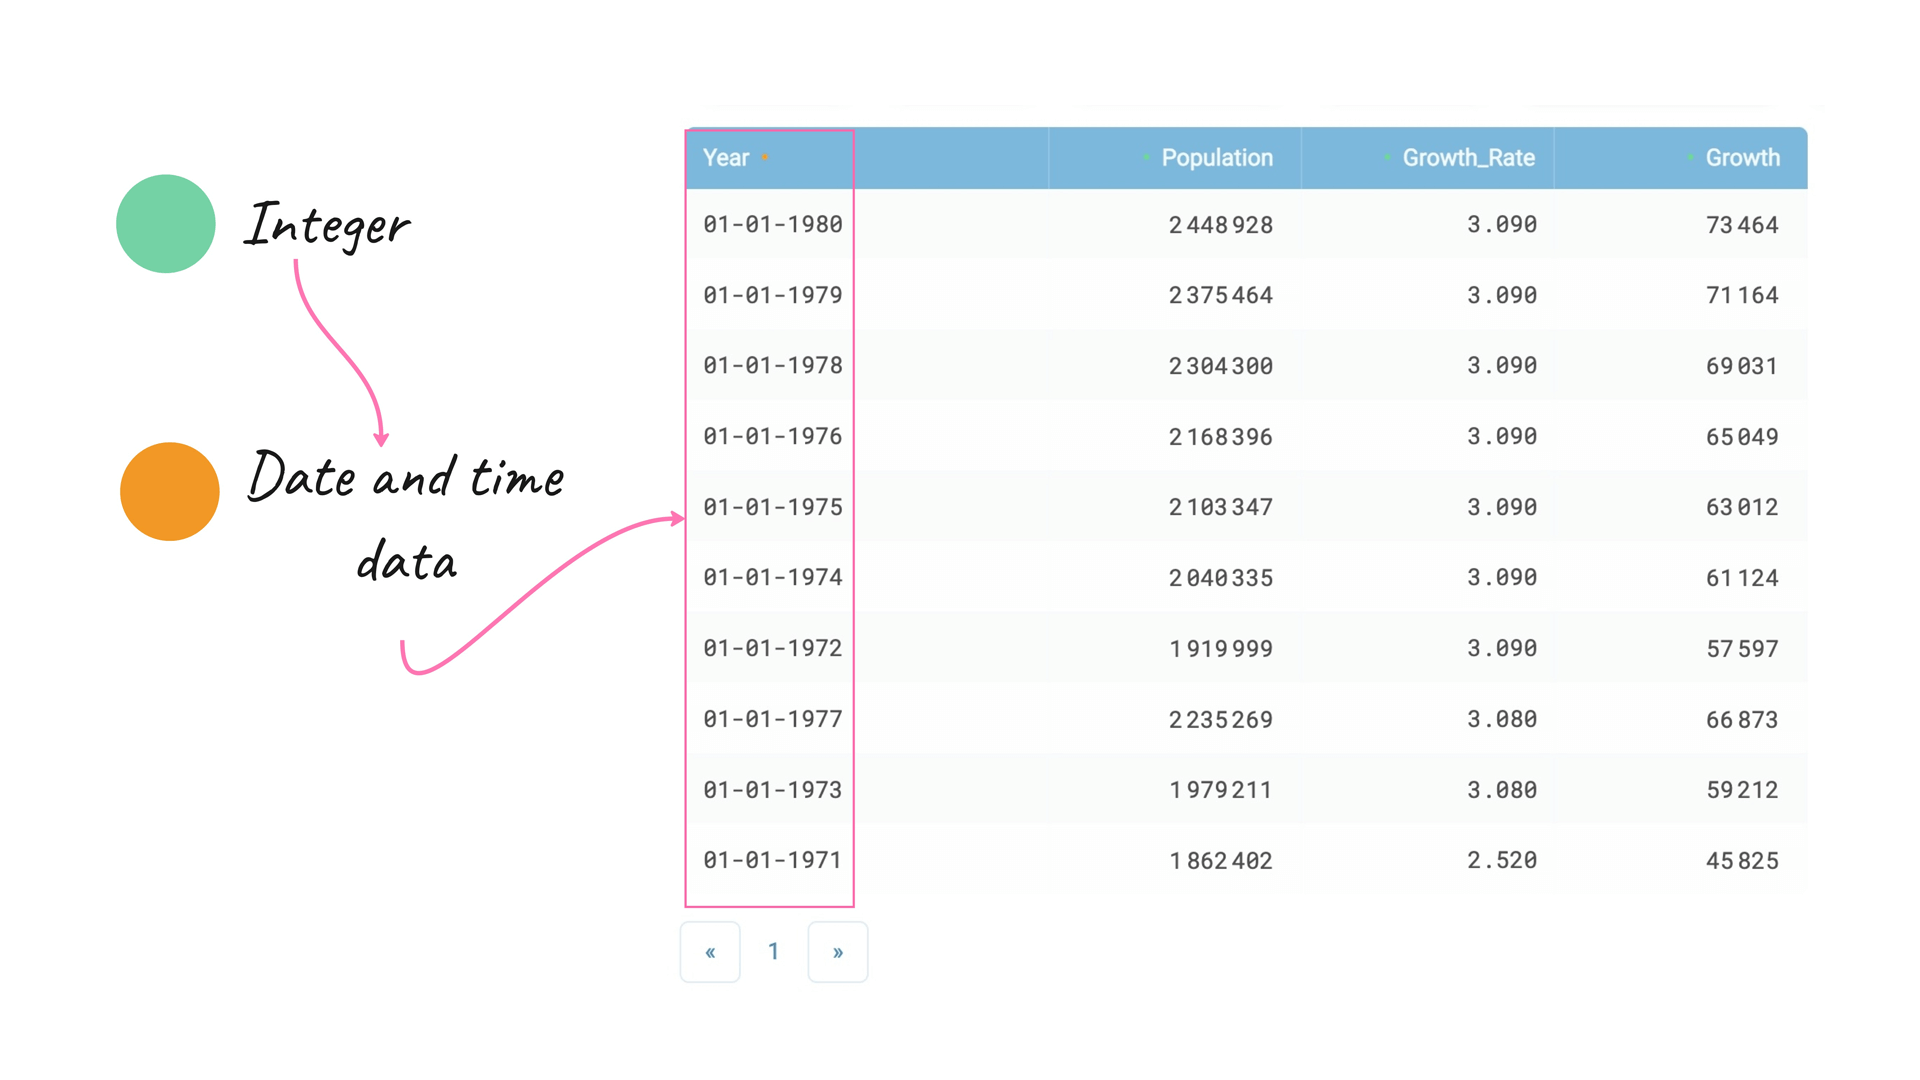
TABLUM.IO has Color-Coded Data Type Identification to help quickly identify the data types you are working with:
In this example, TABLUM.IO recognizes the “Year” as an integer number and we may want to change its type to DateTime. To do this, you need to Right Click on the column and select Transform → Set Type: Date
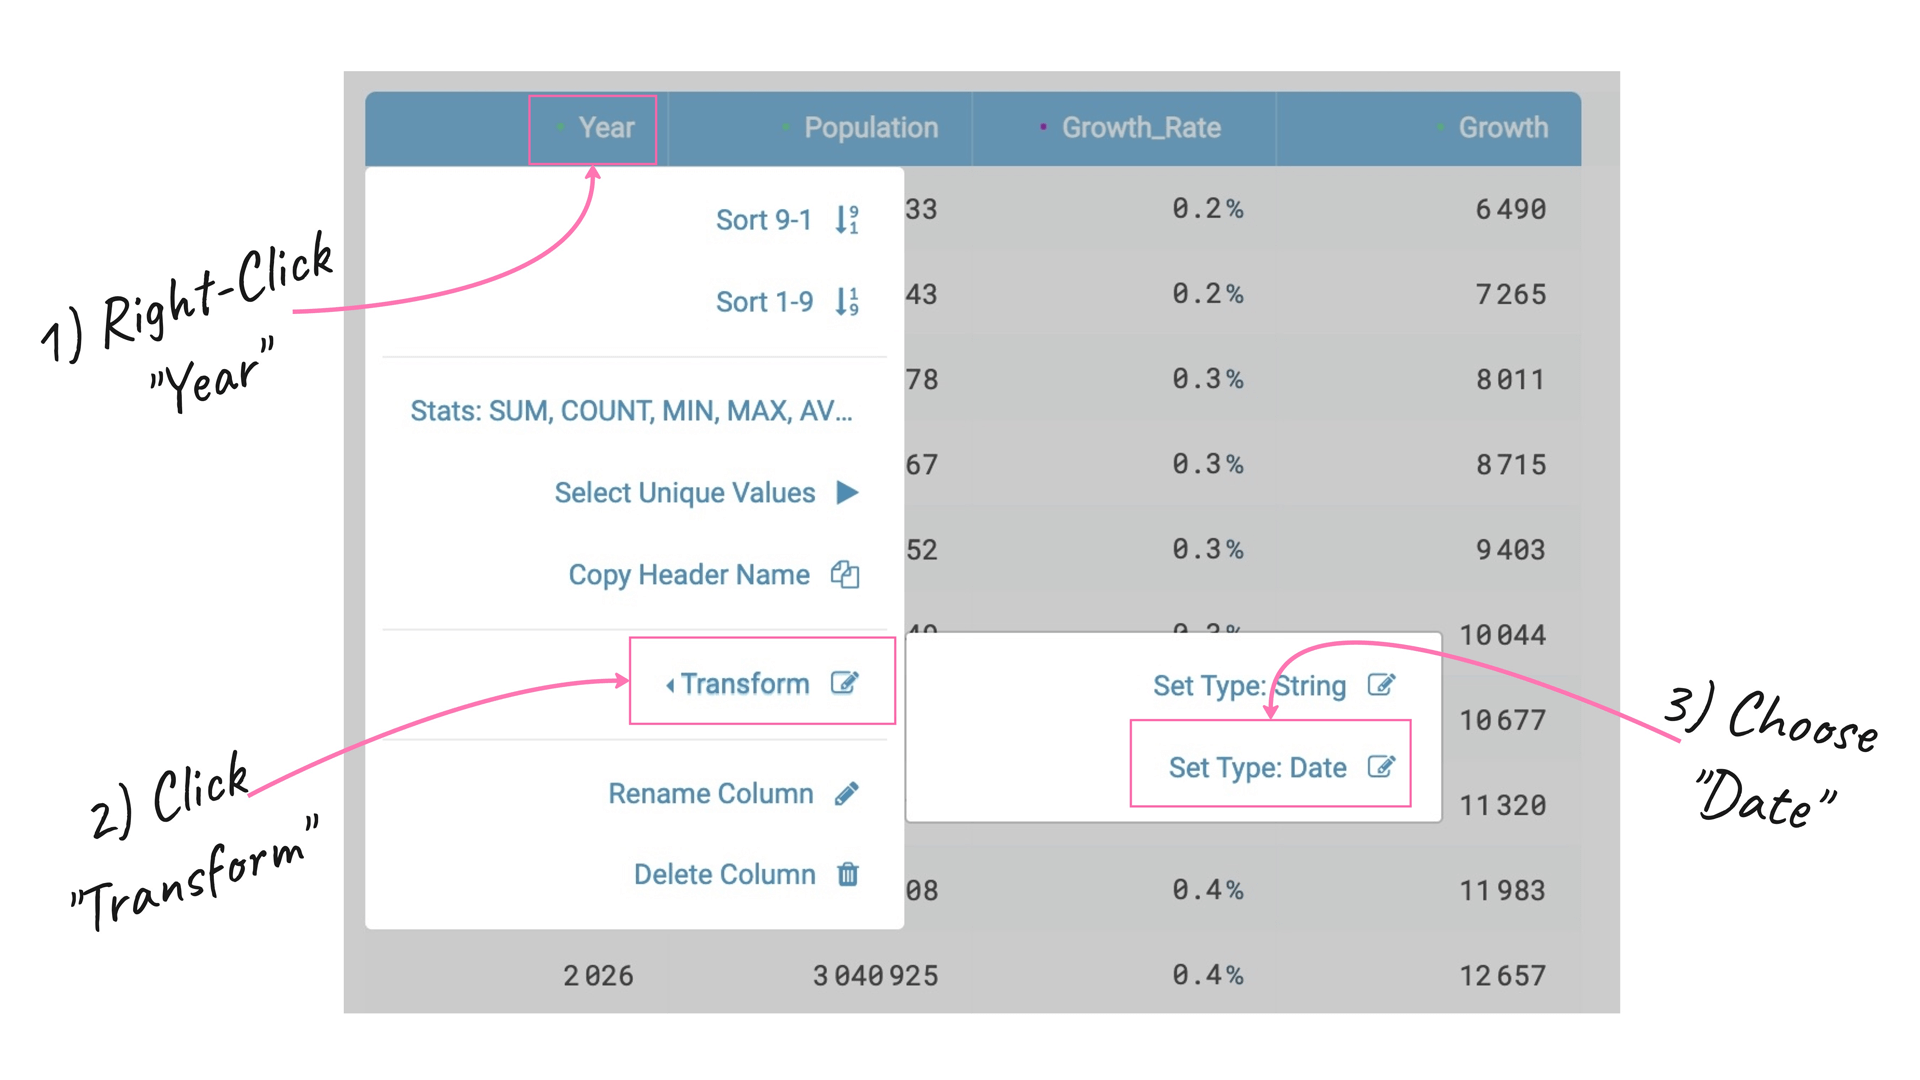
Now the Date Column looks correct:
That’s all so far. Thank you for reading this post!
Come and try TABLUM.IO for free!
Check out this video to have a better understanding of how TABLUM.IO helps to create a relational database from data represented as an HTML table via simple copy-and-paste.
Next time I’m going to share with you more tips on how to make your data preparation routine more productive and pleasant.
Stay tuned :)
